
March 2012 Surface Trade with Canada and Mexico Highest on Record Exceeding $85 Billion for First Time
Figure 1: North American Surface Trade, Five Years: April 2007-March 2012
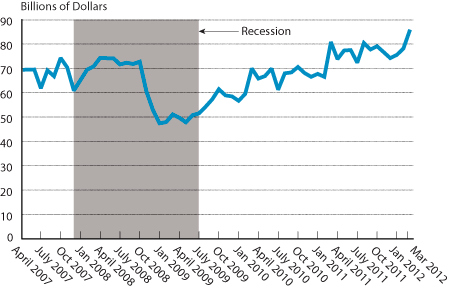
Tuesday, May 29, 2012 - Trade using surface transportation between the United States and its North American Free Trade Agreement (NAFTA) partners, Canada and Mexico, was 6.2 percent higher in March 2012 than in March 2011, totaling $85.8 billion (Table 1), according to the Bureau of Transportation Statistics (BTS) of the U.S. Department of Transportation. March 2012 was the highest month for NATFA trade value since collection of data began in 1994, exceeding $85 billion for the first time and topping the previous record of $80.8 billion in March 2011.
BTS, a part of the Research and Innovative Technology Administration, reported that the March 2012 value of U.S. surface transportation trade with Canada and Mexico rose 21.2 percent from March 2008, early in the recession, and 68.1 percent from March 2009, late in the recession (Table 3). Numbers in the press release are not adjusted for inflation.
The value of U.S. surface transportation trade with Canada and Mexico in March increased by 88.2 percent compared to March 2002, a period of 10 years.Imports in March were up 76.1 percent since March 2002, while exports were up 104.5 percent (Table 3). See Transborder Press Releases for historical data.
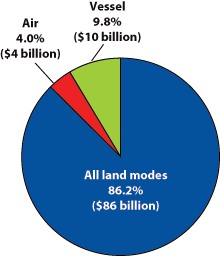
Surface transportation includes freight movements by truck, rail, pipeline, mail, Foreign Trade Zones, and other modes of transport. In March, 86.2 percent of U.S. trade by value with Canada and Mexico moved via land, 9.8 percent moved by vessel, and 4.0 percent moved by air (Figure 2).
Figure 2: North American Freight by Mode, March 2012
| Mode | Total Trade Value | Percent |
| All Modes | 99,510,432,083 | 100.0 |
| All Land Modes | 85,826,858,416 | 86.2 |
| Air | 3,941,907,510 | 4.0 |
| Vessel | 9,741,666,157 | 9.8 |
The value of U.S. surface transportation trade with Canada and Mexico increased 9.8 percent in March 2012 from February 2012 (Table 2). Month-to-month changes can be affected by seasonal variations and other factors.
U.S.-Canada and U.S.-Mexico surface transportation trade in March 2012 both increased compared to March 2011 with U.S.-Canada trade reaching $50.1 billion, a 2.9 percent increase, and U.S.-Mexico trade reaching $35.7 billion, an 11.2 percent increase. For trade statistics by mode, see Table 4 for Canada and Table 6for Mexico.
In March, Michigan led all states in surface trade with Canada as it has in previous years, at $6.3 billion, a 3.0 percent increase from March 2011 (Table 5). Of the top 10 states by value, Illinois had the largest percentage increase over March 2011, at 16.5 percent.
The top commodity category transported between the U.S. and Canada by surface modes of transportation in March was vehicles (other than railway), valued at $9.6 billion (Table 8).
Texas also continued to lead all states in surface trade with Mexico at $12.6 billion, a 11.5 percent increase from March 2011 (Table 7). This is the highest monthly level of trading by any state with Mexico and the first time on record that any state has had more than $12 billion of monthly trade with Mexico. Of the top 10 states by value, Tennessee had the biggest percentage increase, 26.3 percent. The top commodity category transported between the U.S. and Mexico by surface modes of transportation in March was electrical machinery with $7.6 billion in trade (Table 9).
For more information, see Transborder Press Releases for previous' press releases and summary tables. See TransBorder Freight Data for data from previous months, and individual state data. BTS has scheduled release of April TransBorder numbers for June 26.
TABLE 1. VALUE OF MONTHLY U.S. SURFACE TRANSPORTATION TRADE WITH CANADA AND MEXICO
(millions of dollars)
| Month | 2010 | 2011 | 2012 | Percent Change 2010-2011 | Percent Change 2011-2012 |
|---|---|---|---|---|---|
| January | 56,697 | 67,734 | 75,534 | 19.5 | 11.5 |
| February | 59,492 | 66,534 | 78,135 | 11.8 | 17.4 |
| March | 69,943 | 80,822 | 85,827 | 15.6 | 6.2 |
| April | 65,831 | 73,767 | 12.1 | ||
| May | 66,805 | 77,318 | 15.7 | ||
| June | 69,859 | 77,521 | 11.0 | ||
| July | 61,260 | 72,363 | 18.1 | ||
| August | 67,964 | 80,406 | 18.3 | ||
| September | 68,324 | 77,725 | 13.8 | ||
| October | 70,565 | 79,040 | 12.0 | ||
| November | 68,060 | 76,672 | 12.7 | ||
| December | 66,530 | 74,230 | 11.6 | ||
| Year-to-date | 186,132 | 215,090 | 239,496 | 15.6 | 11.3 |
| Annual | 791,329 | 904,133 | 14.3 |
SOURCE: BTS TransBorder Freight Data, https://data.bts.gov/stories/s/TransBorder-Freight-Data/myhq-rm6q/
NOTE: Numbers might not add to totals due to rounding. Percent changes based on numbers prior to rounding.
TABLE 2. U.S. SURFACE TRADE WITH CANADA AND MEXICO BY SURFACE MODES OF TRANSPORTATION
(millions of dollars)
| Mode | March 2011 | February 2012 | March 2012 | Percent Change February 2012 - March 2012 | Percent Change March 2011 - 2012 | |
|---|---|---|---|---|---|---|
| All Surface Modes | Imports | 43,409 | 42,198 | 46,132 | 9.3 | 6.3 |
| Exports | 37,413 | 35,937 | 39,695 | 10.5 | 6.1 | |
| Total | 80,822 | 78,135 | 85,827 | 9.8 | 6.2 | |
| Truck | Imports | 27,489 | 26,087 | 28,932 | 10.9 | 5.3 |
| Exports | 29,036 | 27,491 | 30,826 | 12.1 | 6.2 | |
| Rail | Imports | 8,358 | 8,668 | 9,352 | 7.9 | 11.9 |
| Exports | 4,817 | 4,751 | 5,313 | 11.8 | 10.3 | |
| Pipeline | Imports | 5,954 | 6,032 | 6,400 | 6.1 | 7.5 |
| Exports | 729 | 1,144 | 889 | -22.2 | 22.0 |
SOURCE: BTS TransBorder Freight Data, https://data.bts.gov/stories/s/TransBorder-Freight-Data/myhq-rm6q/
NOTES: Numbers might not add to totals due to rounding. Percent changes based on numbers prior to rounding. The value of trade for all surface modes is not equal to the sum of truck, rail and pipeline modes, it also includes shipments made by mail, foreign trade zones, and other transportation. For additional detail, please refer to the TransBorder web page:https://data.bts.gov/stories/s/TransBorder-Freight-Data/myhq-rm6q/
TABLE 3. MARCH 2012 SURFACE TRADE WITH CANADA AND MEXICO COMPARED WITH MARCH OF PRIOR YEARS
| Compared to March in... | Percent Change | ||
|---|---|---|---|
| Imports | Exports | Total Surface Trade | |
| 2011 | 6.3 | 6.1 | 6.2 |
| 2010 | 21.4 | 24.3 | 22.7 |
| 2009 | 69.8 | 66.2 | 68.1 |
| 2008 | 15.1 | 29.3 | 21.2 |
| 2007 | 15.6 | 33.0 | 23.0 |
| 2006 | 20.0 | 33.3 | 25.8 |
| 2005 | 37.2 | 53.8 | 44.4 |
| 2004 | 44.1 | 63.7 | 52.5 |
| 2003 | 60.8 | 92.0 | 73.9 |
| 2002 | 76.1 | 104.5 | 88.2 |
SOURCE: BTS TransBorder Freight Data, https://data.bts.gov/stories/s/TransBorder-Freight-Data/myhq-rm6q/
TABLE 4. U.S. MERCHANDISE TRADE WITH CANADA BY SURFACE MODES OF TRANSPORTATION
(millions of dollars)
| Mode | March 2011 | February 2012 | March 2012 | Percent Change February 2012 - March 2012 | Percent Change March 2011 - 2012 | |
|---|---|---|---|---|---|---|
| All Surface Modes | Imports | 25,379 | 23,950 | 25,963 | 8.4 | 2.3 |
| Exports | 23,343 | 21,489 | 24,161 | 12.4 | 3.5 | |
| Total | 48,722 | 45,440 | 50,124 | 10.3 | 2.9 | |
| Truck | Imports | 12,493 | 11,193 | 12,271 | 9.6 | -1.8 |
| Exports | 18,077 | 16,124 | 18,620 | 15.5 | 3.0 | |
| Rail | Imports | 5,722 | 5,696 | 6,199 | 8.8 | 8.3 |
| Exports | 2,692 | 2,581 | 2,939 | 13.9 | 9.2 | |
| Pipeline | Imports | 5,936 | 6,015 | 6,376 | 6.0 | 7.4 |
| Exports | 400 | 807 | 574 | -28.8 | 43.5 |
SOURCE: BTS TransBorder Freight Data, https://data.bts.gov/stories/s/TransBorder-Freight-Data/myhq-rm6q/
NOTES: Numbers might not add to totals due to rounding. Percent changes based on numbers prior to rounding. The value of trade for all surface modes is not equal to the sum of truck, rail and pipeline modes, it also includes shipments made by mail, foreign trade zones, and other transportation. For additional detail, please refer to the TransBorder web page:https://data.bts.gov/stories/s/TransBorder-Freight-Data/myhq-rm6q/
TABLE 5. TOP 10 STATES TRADING WITH CANADA BY ALL SURFACE MODES OF TRANSPORTATION
Ranked by March 2012 Surface Trade Value
(millions of dollars)
| State | March 2011 | March 2012 | Percent Change March 2011-2012 | ||
|---|---|---|---|---|---|
| Value | Rank | Value | Rank | ||
| Michigan | 6,118 | 1 | 6,300 | 1 | 3.0 |
| Illinois | 4,720 | 2 | 5,500 | 2 | 16.5 |
| California | 2,889 | 5 | 3,199 | 3 | 10.7 |
| Ohio | 3,321 | 3 | 3,019 | 4 | -9.1 |
| Texas | 2,651 | 6 | 2,947 | 5 | 11.1 |
| New York | 2,936 | 4 | 2,452 | 6 | -16.5 |
| Pennsylvania | 1,838 | 7 | 1,932 | 7 | 5.1 |
| Indiana | 1,661 | 9 | 1,739 | 8 | 4.7 |
| Washington | 1,817 | 8 | 1,671 | 9 | -8.0 |
| Minnesota | 1,449 | 10 | 1,508 | 10 | 4.1 |
SOURCE: BTS TransBorder Freight Data, https://data.bts.gov/stories/s/TransBorder-Freight-Data/myhq-rm6q/
NOTES: Numbers might not add to totals due to rounding. Percent changes based on numbers prior to rounding.
TABLE 6. U.S. MERCHANDISE TRADE WITH MEXICO BY SURFACE MODES OF TRANSPORTATION
(millions of dollars)
| Mode | March 2011 | February 2012 | March 2012 | Percent Change February 2012 - March 2012 | Percent Change March 2011 - 2012 | |
|---|---|---|---|---|---|---|
| All Surface Modes | Imports | 18,030 | 18,248 | 20,169 | 10.5 | 11.9 |
| Exports | 14,070 | 14,447 | 15,533 | 7.5 | 10.4 | |
| Total | 32,099 | 32,696 | 35,703 | 9.2 | 11.2 | |
| Truck | Imports | 14,996 | 14,894 | 16,662 | 11.9 | 11.1 |
| Exports | 10,959 | 11,367 | 12,206 | 7.4 | 11.4 | |
| Rail | Imports | 2,636 | 2,972 | 3,154 | 6.1 | 19.6 |
| Exports | 2,125 | 2,170 | 2,373 | 9.4 | 11.7 | |
| Pipeline | Imports | 18 | 18 | 24 | 33.5 | 33.9 |
| Exports | 329 | 337 | 315 | -6.5 | -4.3 |
SOURCE: BTS TransBorder Freight Data, https://data.bts.gov/stories/s/TransBorder-Freight-Data/myhq-rm6q/
NOTES: Numbers might not add to totals due to rounding. Percent changes based on numbers prior to rounding. The value of trade for all surface modes is not equal to the sum of truck, rail and pipeline modes, it also includes shipments made by mail, foreign trade zones, and other transportation. For additional detail, please refer to the TransBorder web page:https://data.bts.gov/stories/s/TransBorder-Freight-Data/myhq-rm6q/
TABLE 7. TOP 10 STATES TRADING WITH MEXICO BY ALL SURFACE MODES OF TRANSPORTATION
Ranked by March 2012 Surface Trade Value
(millions of dollars)
| State | March 2011 | March 2012 | Percent Change March 2011-2012 | ||
|---|---|---|---|---|---|
| Value | Rank | Value | Rank | ||
| Texas | 11,341 | 1 | 12,640 | 1 | 11.5 |
| California | 4,442 | 2 | 5,187 | 2 | 16.8 |
| Michigan | 3,612 | 3 | 4,203 | 3 | 16.4 |
| Arizona | 1,095 | 4 | 1,282 | 4 | 17.1 |
| Illinois | 1,059 | 5 | 1,178 | 5 | 11.2 |
| Ohio | 913 | 6 | 942 | 6 | 3.1 |
| Tennessee | 617 | 7 | 779 | 7 | 26.3 |
| Indiana | 572 | 9 | 718 | 8 | 25.7 |
| North Carolina | 547 | 10 | 568 | 9 | 3.8 |
| Georgia | 583 | 8 | 470 | 10 | -19.3 |
SOURCE: BTS TransBorder Freight Data, https://data.bts.gov/stories/s/TransBorder-Freight-Data/myhq-rm6q//
NOTE: Percent changes based on numbers prior to rounding
TABLE 8. TOP FIVE COMMODITIES TRANSPORTED BETWEEN THE U.S. AND CANADA BY ALL SURFACE MODES OF TRANSPORTATION, MARCH 2012
(millions of dollars)
| Commodities | Exports | Imports | Total |
|---|---|---|---|
| Vehicles Other than Railway | 4,781 | 4,852 | 9,633 |
| Oil and Gas | 1,082 | 7,702 | 8,784 |
| Computer-Related Machinery and Parts | 4,174 | 1,695 | 5,869 |
| Electrical Machinery; Equipment and Parts | 2,050 | 702 | 2,752 |
| Plastics | 1,116 | 922 | 2,038 |
SOURCE: U.S. Department of Transportation, Research and Innovative Technology Administration, Bureau of Transportation Statistics, based on Transborder Freight Data, available athttps://data.bts.gov/stories/s/TransBorder-Freight-Data/myhq-rm6q/, as of March 20, 2012.
NOTE: Numbers may not add to totals due to rounding.
TABLE 9. TOP FIVE COMMODITIES TRANSPORTED BETWEEN THE U.S. AND MEXICO BY ALL SURFACE MODES OF TRANSPORTATION, MARCH 2012
(millions of dollars)
| Commodities | Exports | Imports | Total |
|---|---|---|---|
| Electrical Machinery; Equipment and Parts | 2,706 | 4,863 | 7,569 |
| Computer-Related Machinery and Parts | 2,976 | 3,785 | 6,761 |
| Vehicles Other than Railway | 1,678 | 4,400 | 6,079 |
| Plastics | 1,170 | 321 | 1,491 |
| Measuring and Testing Instruments | 409 | 883 | 1,292 |
SOURCE: U.S. Department of Transportation, Research and Innovative Technology Administration, Bureau of Transportation Statistics, based on Transborder Freight Data, available athttps://data.bts.gov/stories/s/TransBorder-Freight-Data/myhq-rm6q/, as of March 13, 2012.
NOTE: Numbers may not add to totals due to rounding.