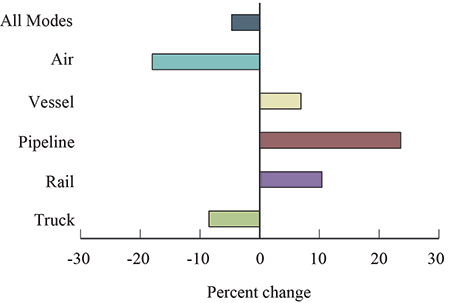
Percent Change in Value of U.S.-Mexico Freight Flows by Mode: October 2015-2016
Figure

Dataset Table:
| Mode | Percent Change |
|---|---|
| Truck | -8.5 |
| Rail | 10.4 |
| Pipeline | 23.6 |
| Vessel | 6.9 |
| Air | -18.0 |
| All Modes | -4.7 |
Description:
From October 2015 to October 2016, the value of U.S.-Mexico freight flows fell 4.7 percent to $46.6 billion due to decreases in the value of goods moved by air (down 18.0 percent) and truck (down 8.5 percent). The value of freight carried on three modes increased: pipeline, by 23.6 percent; rail by 10.4 percent; and vessel by 6.9 percent.
Trucks carried 69.9 percent of the value of the freight to and from Mexico. Rail carried 15.4 percent of the value of freight to and from Mexico followed by vessel, 7.9 percent; air, 3.1 percent; and pipeline, 0.8 percent. The surface transportation modes of truck, rail and pipeline carried 86.0 percent of the value of total U.S.-Mexico freight flows.
Source:
Bureau of Transportation Statistics, TransBorder Freight Data, https://data.bts.gov/stories/s/TransBorder-Freight-Data/myhq-rm6q/
