
Percent Change in Value of U.S.-NAFTA Freight Flows by Mode: September 2015-2016
Figure
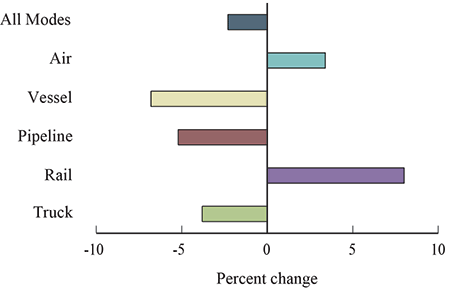
Dataset Table:
| Mode | September 2015 | September 2016 | Percent Change September 2015-2016 | |
|---|---|---|---|---|
| All Modes | Imports | 50,497 | 48,755 | -3.4 |
| Exports | 42,750 | 42,371 | -0.9 | |
| Total | 93,246 | 91,126 | -2.3 | |
| All Surface Modes | Imports | 44,473 | 43,160 | -3.0 |
| Exports | 34,965 | 34,785 | -0.5 | |
| Total | 79,438 | 77,946 | -1.9 | |
| Truck | Imports | 31,705 | 30,100 | -5.1 |
| Exports | 29,580 | 28,865 | -2.4 | |
| Total | 61,285 | 58,965 | -3.8 | |
| Rail | Imports | 8,857 | 9,545 | 7.8 |
| Exports | 4,570 | 4,953 | 8.4 | |
| Total | 13,427 | 14,498 | 8.0 | |
| Pipeline | Imports | 3,912 | 3,515 | -10.1 |
| Exports | 815 | 967 | 18.7 | |
| Total | 4,726 | 4,482 | -5.2 | |
| Vessel | Imports | 2,678 | 2,414 | -9.8 |
| Exports | 2,581 | 2,487 | -3.6 | |
| Total | 5,258 | 4,901 | -6.8 | |
| Air | Imports | 1,604 | 1,646 | 2.7 |
| Exports | 2,047 | 2,127 | 3.9 | |
| Total | 3,651 | 3,773 | 3.4 |
Notes:
Notes: Values in millions of current dollars. Numbers might not add to totals due to rounding. Percent changes based on numbers prior to rounding. The value of trade for all modes is not equal to the sum of truck, rail, pipeline, vessel and air modes, it also includes shipments made by mail, foreign trade zones, and other transportation. For additional detail, please refer to the TransBorder web page.
Source:
Source: Bureau of Transportation Statistics, TransBorder Freight Data