
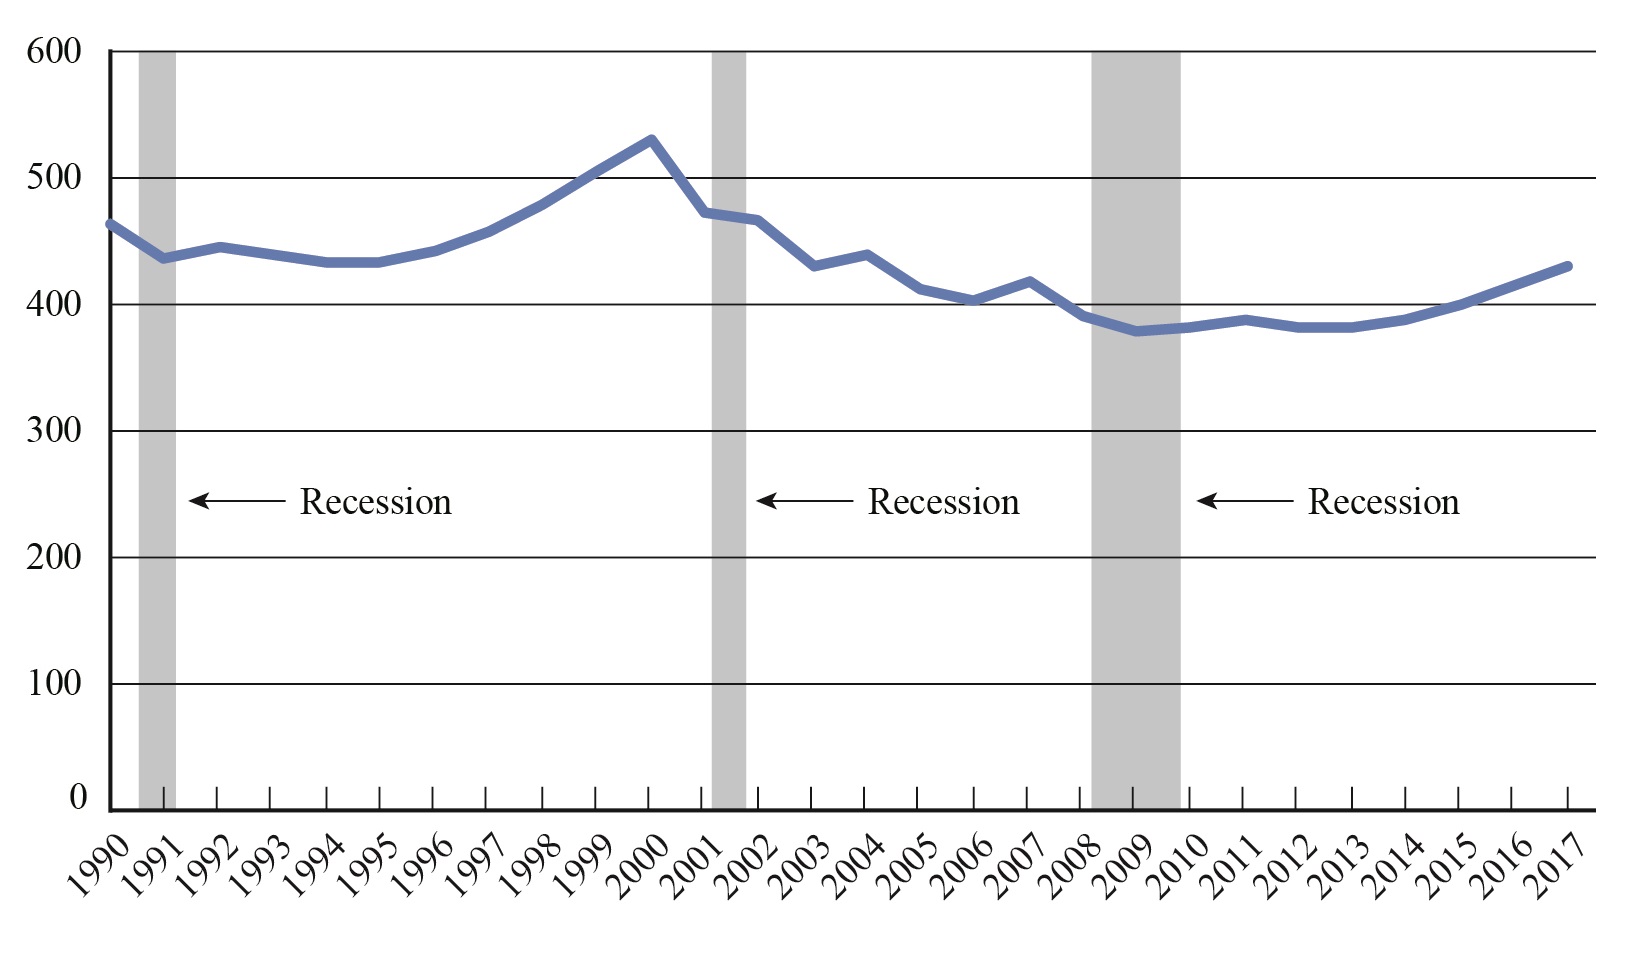
Scheduled Passenger Airline Full-Time Equivalent Employees, Month of November, 1990-2017
FTEs in thousands (000)
Figure
Dataset Table:
| November FTEs in thousands (000) | |
|---|---|
| 1990 | 463.3 |
| 1991 | 437.3 |
| 1992 | 444.4 |
| 1993 | 438.9 |
| 1994 | 431.9 |
| 1995 | 432.6 |
| 1996 | 442.1 |
| 1997 | 456.1 |
| 1998 | 479.5 |
| 1999 | 506.1 |
| 2000 | 529.7 |
| 2001 | 472.7 |
| 2002 | 466.6 |
| 2003 | 430.4 |
| 2004 | 439.8 |
| 2005 | 410.7 |
| 2006 | 403.7 |
| 2007 | 419.3 |
| 2008 | 392.1 |
| 2009 | 379.4 |
| 2010 | 380.2 |
| 2011 | 386.6 |
| 2012 | 381.1 |
| 2013 | 381.2 |
| 2014 | 386.9 |
| 2015 | 401.3 |
| 2016 | 416.0 |
| 2017 | 429.9 |
Source:
Bureau of Transportation Statistics