
Scheduled Passenger Airline Full-Time Equivalent Employees, Month of September, 1990-2017
September FTEs in thousands (000)
Figure
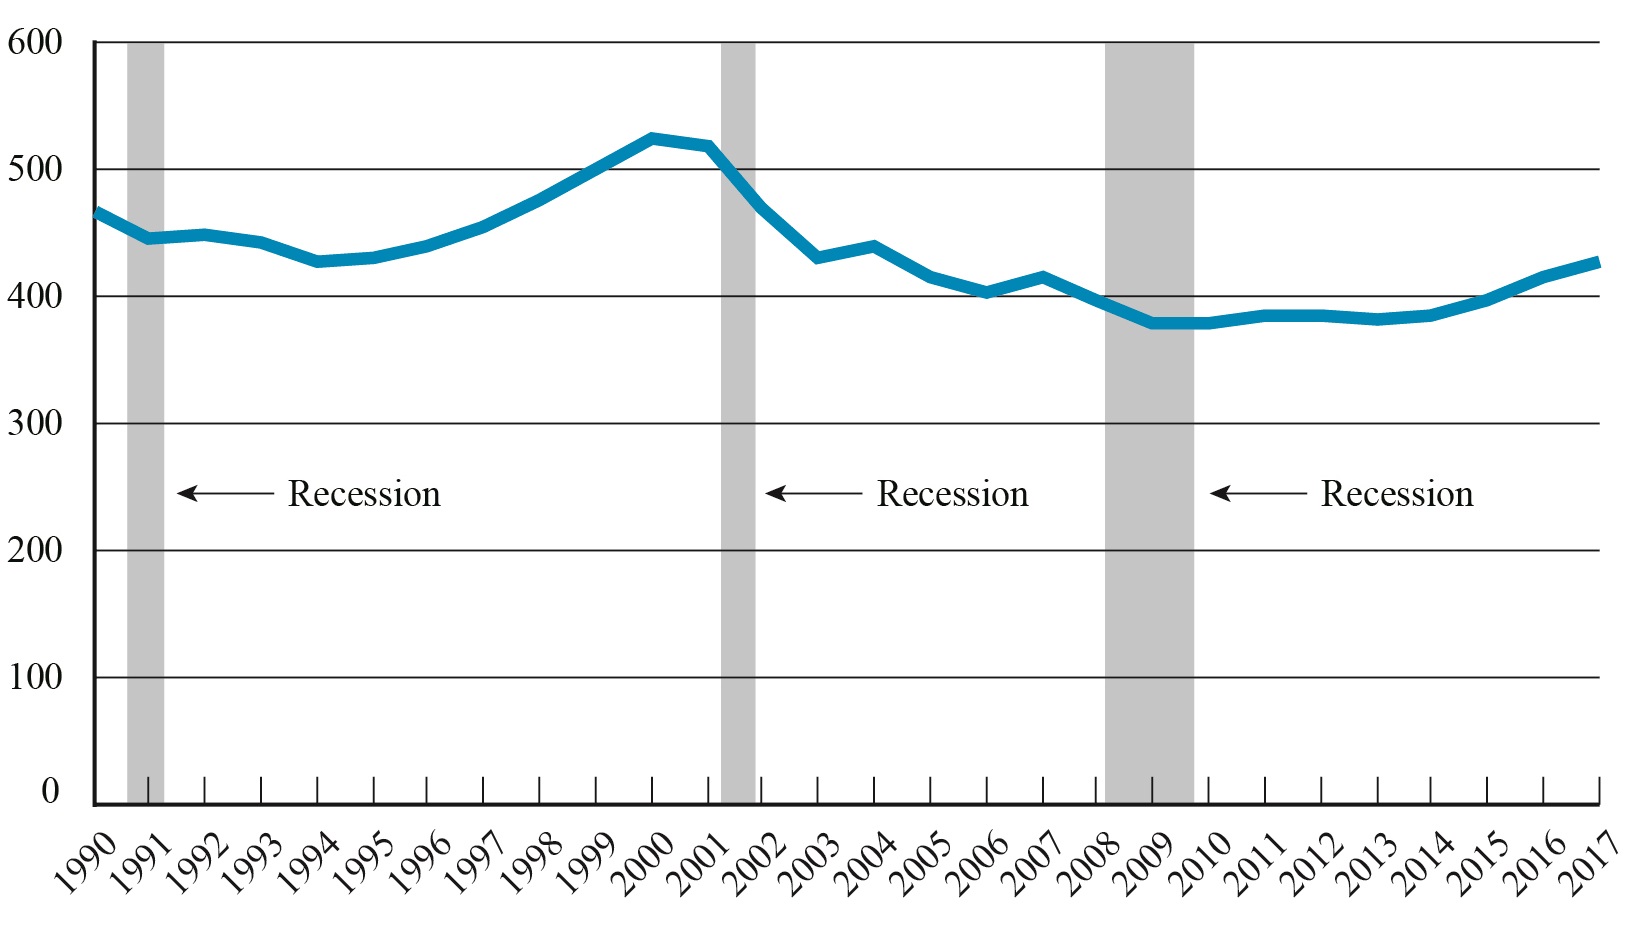
Dataset Table:
| September FTEs in thousands (000) | |
|---|---|
| 1990 | 466.0 |
| 1991 | 445.8 |
| 1992 | 449.5 |
| 1993 | 442.3 |
| 1994 | 426.8 |
| 1995 | 430.5 |
| 1996 | 440.6 |
| 1997 | 454.8 |
| 1998 | 476.0 |
| 1999 | 501.1 |
| 2000 | 524.9 |
| 2001 | 517.7 |
| 2002 | 468.7 |
| 2003 | 430.4 |
| 2004 | 440.1 |
| 2005 | 413.7 |
| 2006 | 403.5 |
| 2007 | 416.1 |
| 2008 | 397.3 |
| 2009 | 379.9 |
| 2010 | 378.3 |
| 2011 | 385.8 |
| 2012 | 383.7 |
| 2013 | 380.2 |
| 2014 | 384.5 |
| 2015 | 397.3 |
| 2016 | 414.6 |
| 2017 | 428.3 |
Source:
Bureau of Transportation Statistics