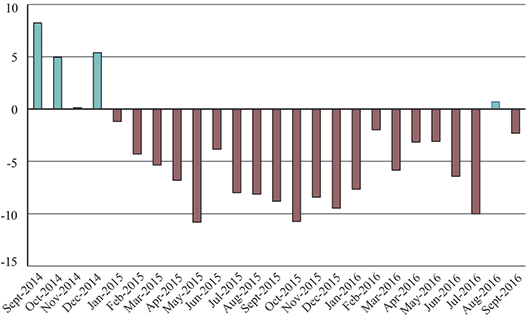
September 2016 North American Freight Numbers
Figure

Dataset Table:
| Month | 2014 | 2015 | 2016 | Percent Change 2014-2015 | Percent Change 2015-2016 | |||||
|---|---|---|---|---|---|---|---|---|---|---|
| January | 90,326 | 89,258 | 82,430 | -1.2 | -7.7 | |||||
| February | 89,557 | 85,723 | 84,038 | -4.3 | -2.0 | |||||
| March | 101,478 | 96,070 | 90,462 | -5.3 | -5.8 | |||||
| April | 100,141 | 93,327 | 90,380 | -6.8 | -3.2 | |||||
| May | 103,942 | 92,707 | 89,840 | -10.8 | -3.1 | |||||
| June | 102,978 | 99,030 | 92,671 | -3.8 | -6.4 | |||||
| July | 101,075 | 92,995 | 83,725 | -8.0 | -10.0 | |||||
| August | 100,624 | 92,442 | 93,126 | -8.1 | 0.7 | |||||
| September | 102,245 | 93,246 | 91,126 | -8.8 | -2.3 | |||||
| October | 108,243 | 96,624 | -10.7 | |||||||
| November | 96,252 | 88,154 | -8.4 | |||||||
| December | 95,811 | 86,748 | -9.5 | |||||||
| Year-to-date | 892,366 | 834,799 | 797,798 | -6.5 | -4.4 | |||||
| Annual | 1,192,671 | 1,106,325 | -7.2 |
Notes:
Note: Values in millions of dollars. Numbers might not add to totals due to rounding. Percent change based on numbers prior to rounding.
Source:
Source: Bureau of Transportation Statistics, TransBorder Freight Data,
