
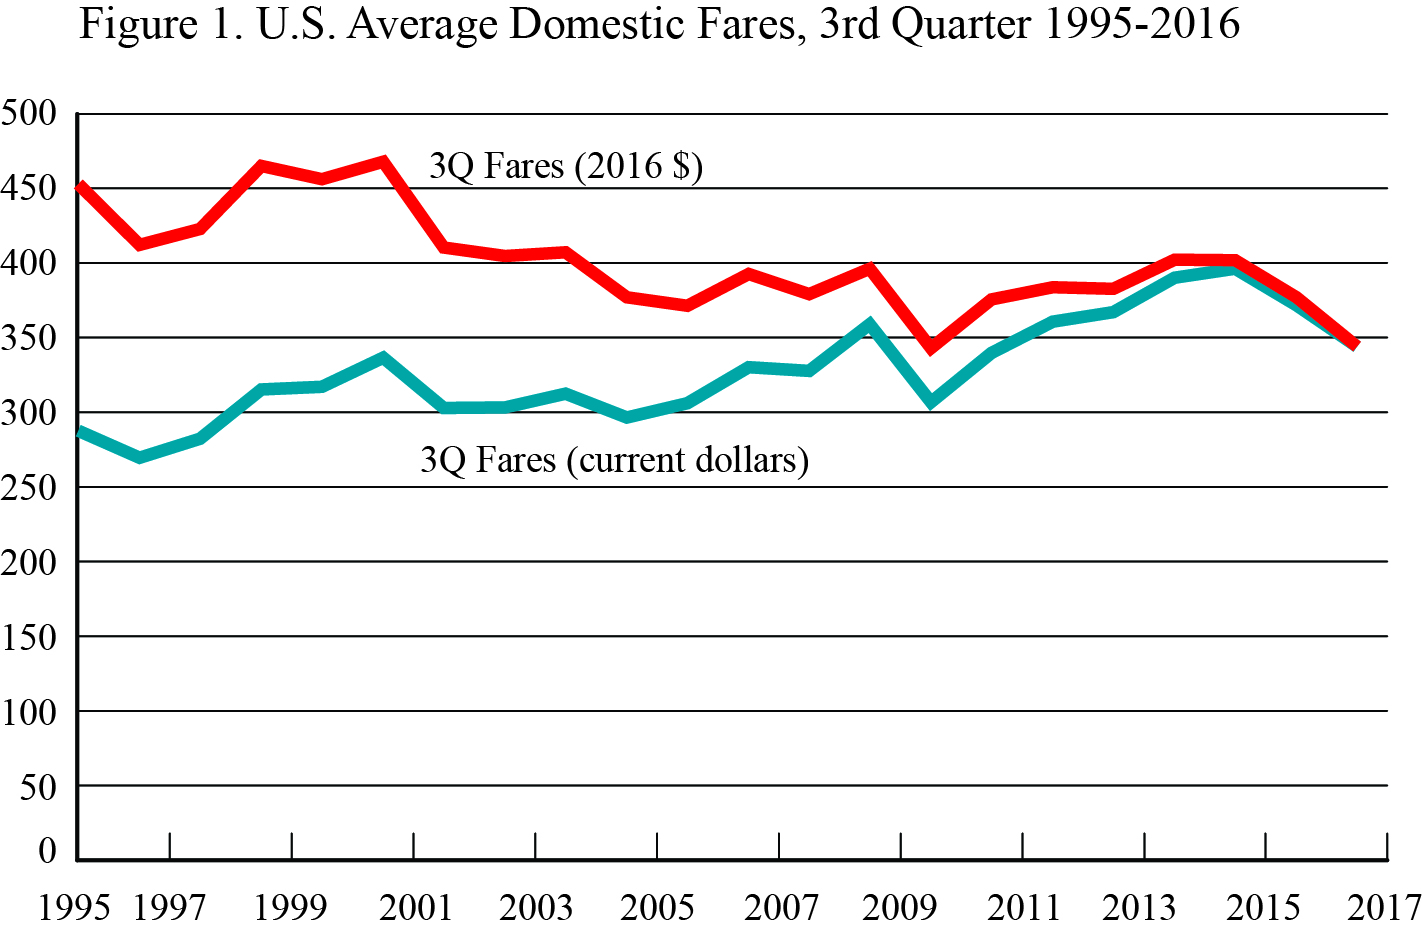
U.S. Average Domestic Fares, 3rd Quarter 1995-2016
Figure
Dataset Table:
| Year | 3Q Fares (current dollars) | 3Q Fares (2016 $) |
|---|---|---|
| 1995 | 288 | 453 |
| 1996 | 269 | 412 |
| 1997 | 282 | 423 |
| 1998 | 315 | 465 |
| 1999 | 317 | 456 |
| 2000 | 337 | 468 |
| 2001 | 303 | 410 |
| 2002 | 303 | 405 |
| 2003 | 312 | 407 |
| 2004 | 297 | 377 |
| 2005 | 306 | 372 |
| 2006 | 330 | 393 |
| 2007 | 328 | 379 |
| 2008 | 359 | 396 |
| 2009 | 307 | 343 |
| 2010 | 340 | 375 |
| 2011 | 361 | 384 |
| 2012 | 367 | 383 |
| 2013 | 390 | 402 |
| 2014 | 396 | 402 |
| 2015 | 372 | 377 |
| 2016 | 344 | 344 |
Source:
Bureau of Transportation Statistics, Origin and Destination Survey: DB1BTicket