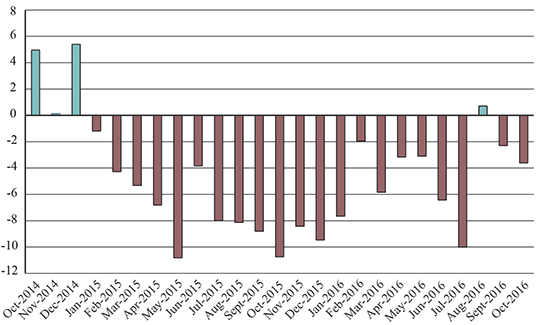
U.S.-NAFTA Freight Value Percent Change from Previous Year (Last 24 months)
Figure

Dataset Table:
| Date | Percent Change |
|---|---|
| 10/2014 | 4.9 |
| 11/2014 | 0.1 |
| 12/2014 | 5.4 |
| 01/2015 | -1.2 |
| 02/2015 | -4.3 |
| 03/2015 | -5.3 |
| 04/2015 | -6.8 |
| 05/2015 | -10.8 |
| 06/2015 | -3.8 |
| 07/2015 | -8.0 |
| 08/2015 | -8.1 |
| 09/2015 | -8.8 |
| 10/2015 | -10.7 |
| 11/2015 | -8.4 |
| 12/2015 | -9.5 |
| 01/2016 | -7.7 |
| 02/2016 | -2.0 |
| 03/2016 | -5.8 |
| 04/2016 | -3.2 |
| 05/2016 | -3.1 |
| 06/2016 | -6.4 |
| 07/2016 | -10.0 |
| 08/2016 | 0.7 |
| 09/2016 | -2.3 |
| 10/2016 | -3.6 |
Description:
Three transportation modes – air, vessel and truck – carried less U.S. freight by value with North American Free Trade Agreement (NAFTA) partners Canada and Mexico in October 2016 compared to October 2015 as total freight on all modes decreased 3.6 percent to $93.2 billion in current dollars, according to the TransBorder Freight Data released today by the U.S. Department of Transportation’s Bureau of Transportation Statistics (BTS).
The total value of cross-border freight has declined from the same month of the previous year in 21 of the past 22 months beginning in January 2015 with only an increase of 0.7 percent in August 2016.
Source:
Bureau of Transportation Statistics, TransBorder Freight Data
