On Earth Day 2022, BTS Looks at Public Transportation Ridership and Tailpipe Emissions
With Americans responding to a slight reprieve in the ongoing COVID-19 pandemic, this Earth Day coincides with the return of many commuters to their workplaces. Because public transportation has consistently offered one of the most effective avenues to reduce transportation’s contribution to greenhouse gas emissions, transit ridership numbers have an impact on our climate. Commute changes adopted during the lingering pandemic could reduce transit demand post-pandemic and, in turn, reduce the environmental benefits of public transit.
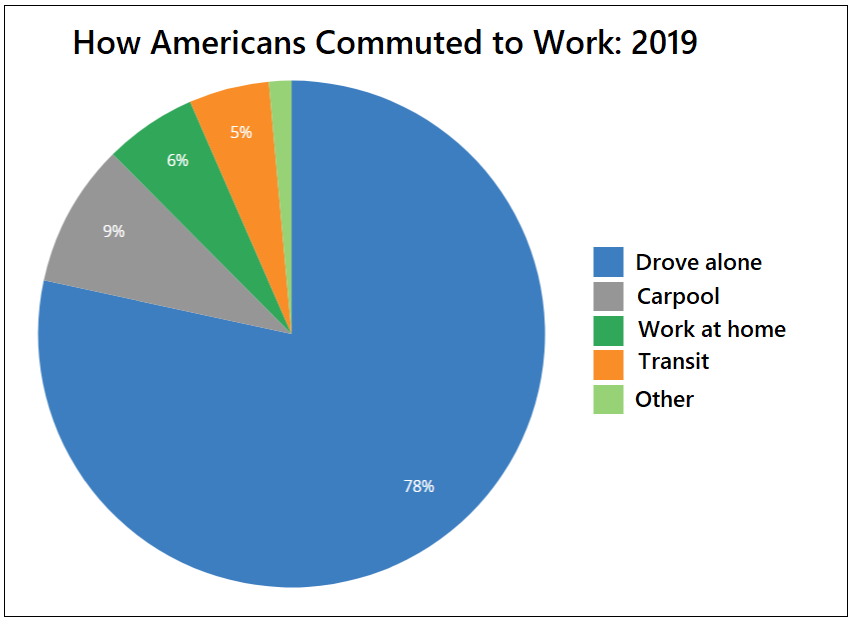
Source: U.S. Dept. of Commerce, Census Bureau, American Community Survey, as reported in BTS National Transportation Statistics
CO2 emissions from gasoline decreased when the pandemic affected vehicle miles traveled.
In the chart above from pre-pandemic 2019, 5% of commuters went to work via transit. The chart below shows CO2 emissions from automotive gasoline since 1975, with a noticeable reduction in emissions in 2020 due to reduced vehicle miles traveled (VMT) during the pandemic. If some commuters abandon transit because of COVID-19 anxieties, VMT could spike and future year emissions could bounce back above 2019 levels.
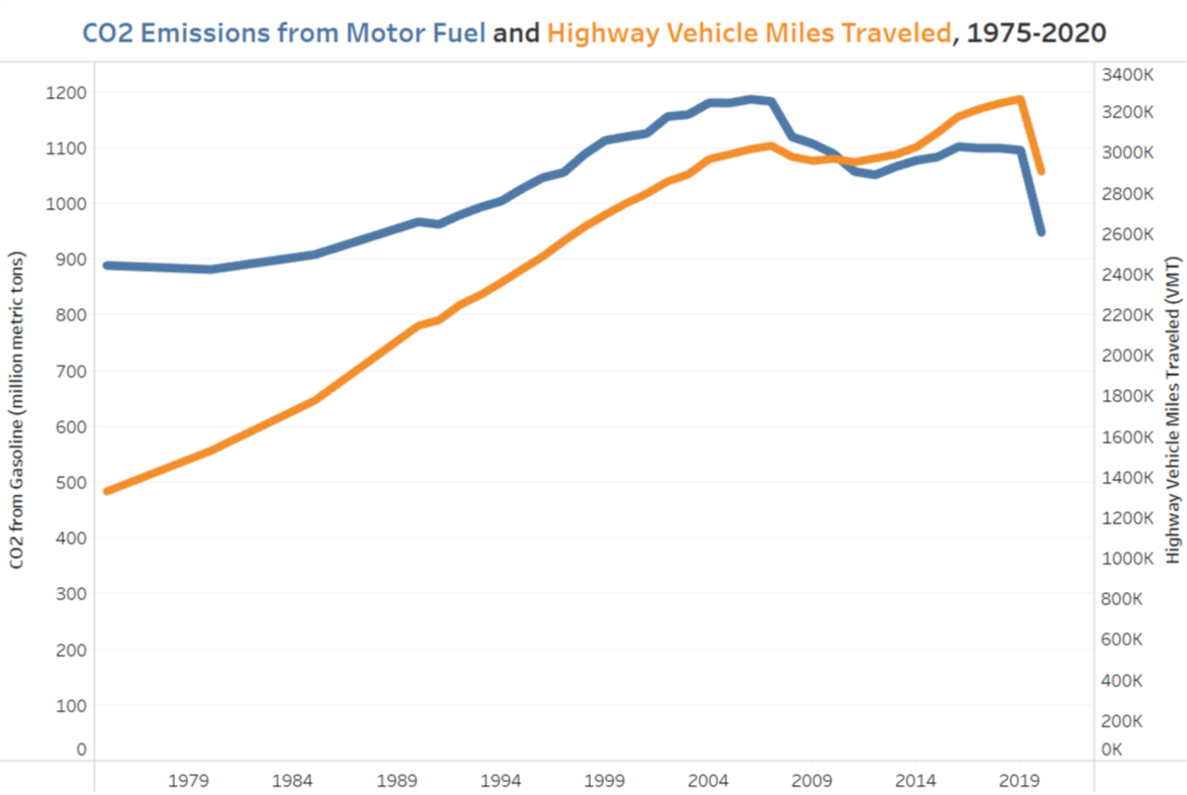
Sources: CO2 - U.S. Dept. of Energy, Energy Information Administration, VMT – U.S. Dept. of Transportation, Federal Highway Administration
Transit ridership in the U.S. is returning steadily, but it remains far below pre-pandemic levels.
Public transportation ridership took a huge hit from COVID-19, especially in the spring of 2020 when the pandemic emerged and lockdowns were implemented.
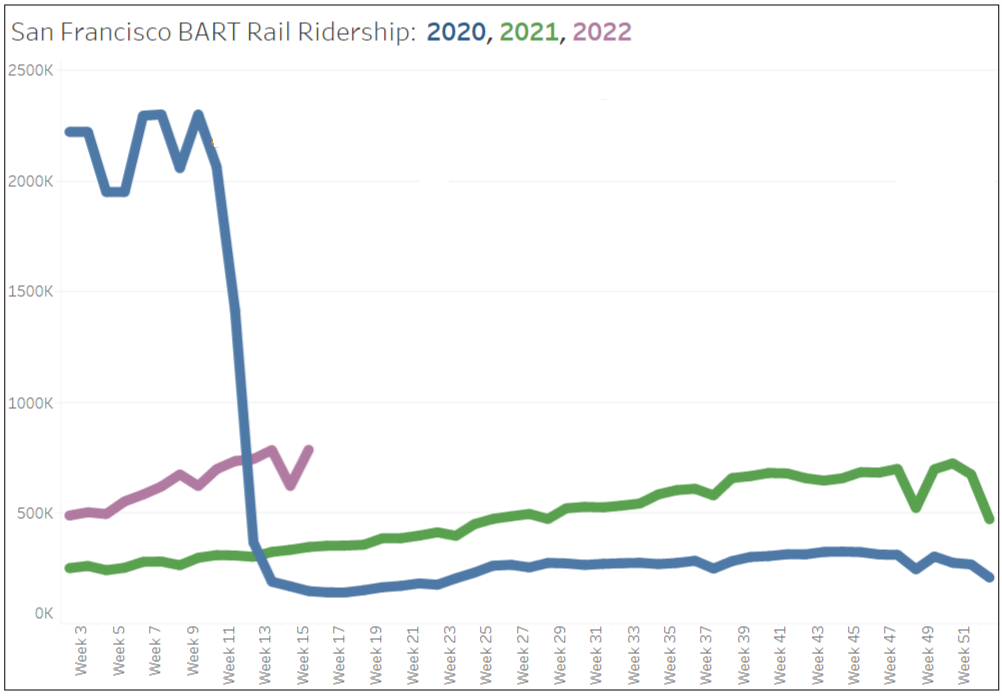
Source: BART
The Bay Area Rapid Transit system in California, as shown above (from the BTS “Latest Weekly COVID-19 Transportation Statistics” page) , paints a clear picture of the precipitous fall in ridership faced by large urban systems. In the week beginning February 29, 2020, BART reported ridership of 1,856,583. By the week beginning March 29 , ridership had plummeted to 187,544. And, by May 17, it had fallen even further to its COVID-19 low of 139, 202 down 94% from BART’s expected volume.
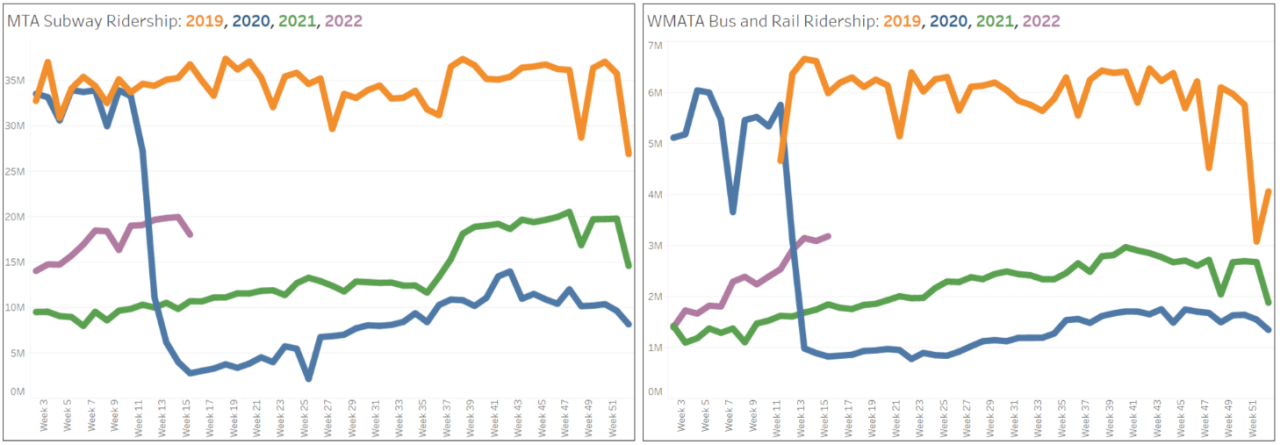
Source: MTA, WMATA
The 2021 transit rebound continues amid variant outbreaks.
Fast forward two years and BTS has observed a slow—yet steady—increase in ridership of large urban transit systems, like BART. As the charts above (also from our “Latest Weekly COVID-19 Transportation Statistics” page) demonstrate, both New York City’s MTA subway system and Washington, DC’s WMATA have clawed their way above 50% of pre-pandemic ridership levels. Like BART, MTA and WMATA have seen increased ridership despite periodic COVID-19 variant outbreaks.
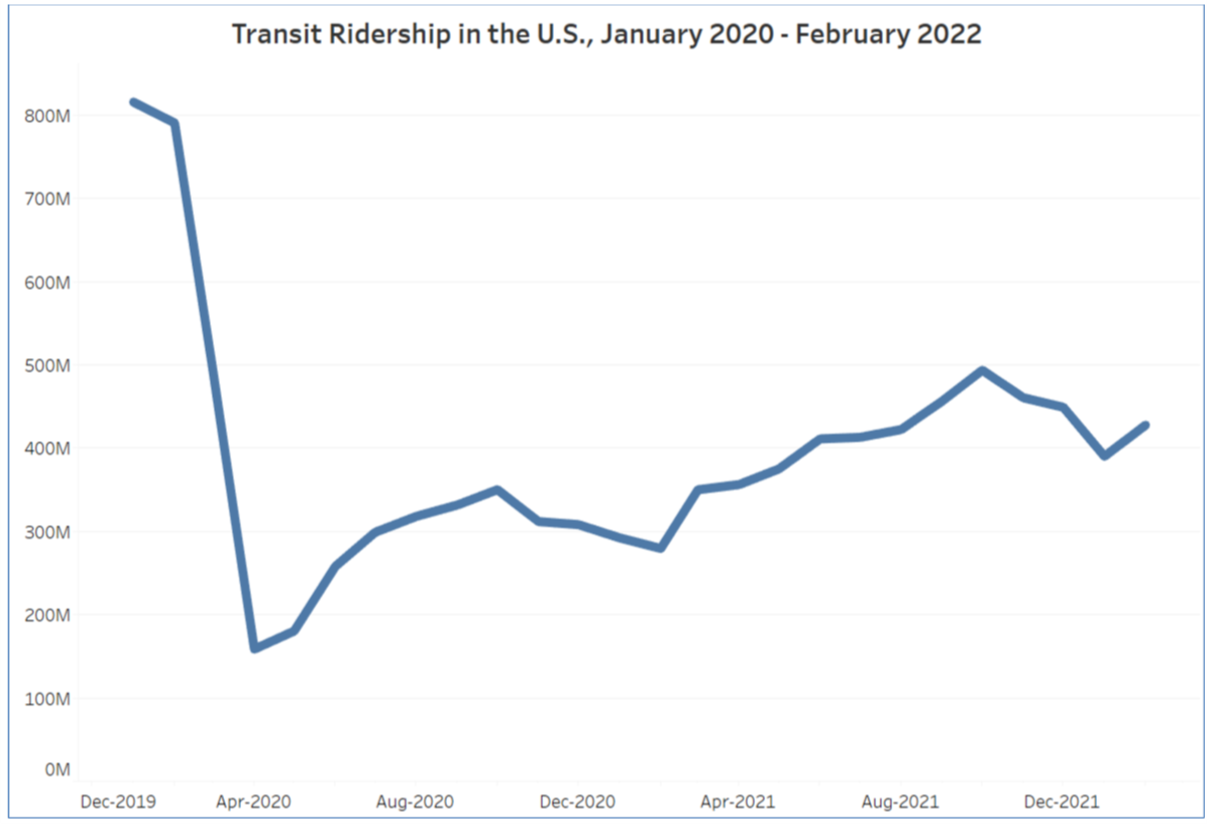
Source: U.S. Dept. of Transportation, Federal Transit Administration
Nationwide transit ridership tops 50% of pre-pandemic levels.
A similar steady return of ridership is occurring nationwide at all levels of transit from bus to light rail to subways. As the chart above shows, total U.S. public transportation ridership—much of which is composed of transit bus passengers—did not fall quite as steeply as urban rail transit ridership, and total ridership began its recovery earlier in the pandemic than rail transit. But, total ridership is still at only about 55% of pre-pandemic levels.
What’s next for U.S. public transportation and tailpipe emissions?
Will anxiety about using transit amid a pandemic keep the transit commute-share below its 5% from 2019? To what extent will workers who have the flexibility to work from home skip the commute altogether? Will returning workers choose to drive alone or start a carpool? How quickly will returning commuters purchase electric vehicles or other clean fuel vehicles? How likely is it that those living in communities with safe streets will choose to walk or bike?
BTS monitors all of these statistics, and we’ll keep reporting on them.
