


Mid-Year 2026 Border Crossing Data Release
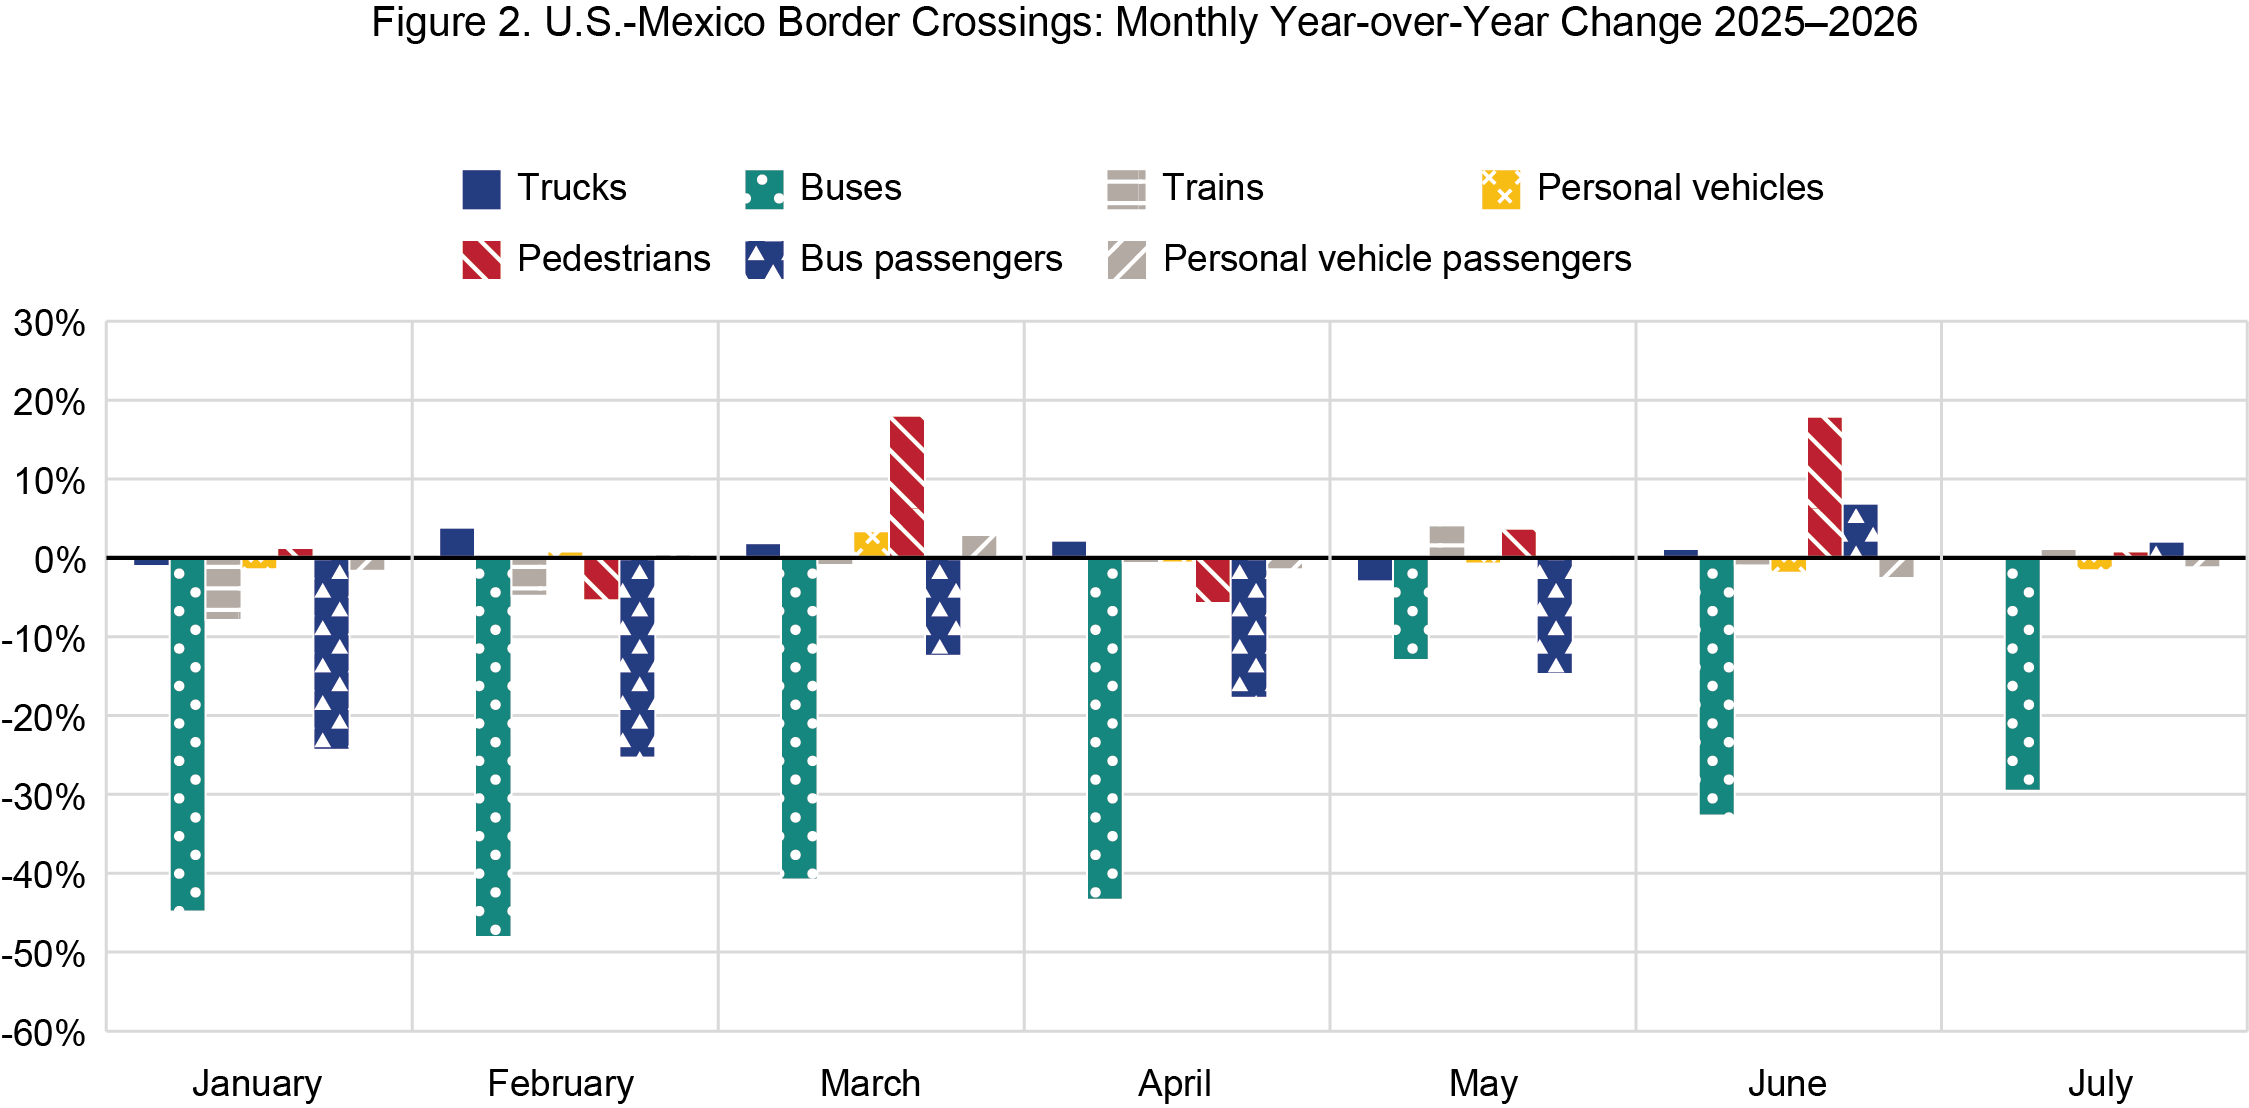
The Bureau of Transportation Statistics (BTS) has released Border Crossing data compiled for July 2026. Coverage includes trucks, buses, trains, personal vehicles, and pedestrians entering the U.S. by land from Canada and Mexico. In July 2026, personal vehicles entering the U.S. from Canada rose 9.4% from July 2025 to 2,124,296, and the passengers they carried rose 11.0% to 4,506,146. On the southern border, personal vehicles entering from Mexico fell 1.6% to 6,240,982 and pedestrians rose 0.8% to 3,570,046. Trucks entering from Canada fell 2.4% to 439,429, while trucks entering from Mexico were essentially unchanged at 650,466. Commercial truck traffic remains stable year-round to support consistent cross-border supply chain demand, while passenger and pedestrian traffic exhibit seasonal volatility. Personal travel volumes peak during the summer months and decline in the winter, contrasting with the steady flow of economy-related industrial trade.
The 2026 FIFA World Cup was played across the United States, Canada, and Mexico from June to July 2026, with Toronto and Vancouver hosting matches in Canada. The remainder of this report focuses on cross-border travel during the FIFA World Cup, showing how crossing volumes at ports along the main fan corridors to host cities responded during the tournament window.
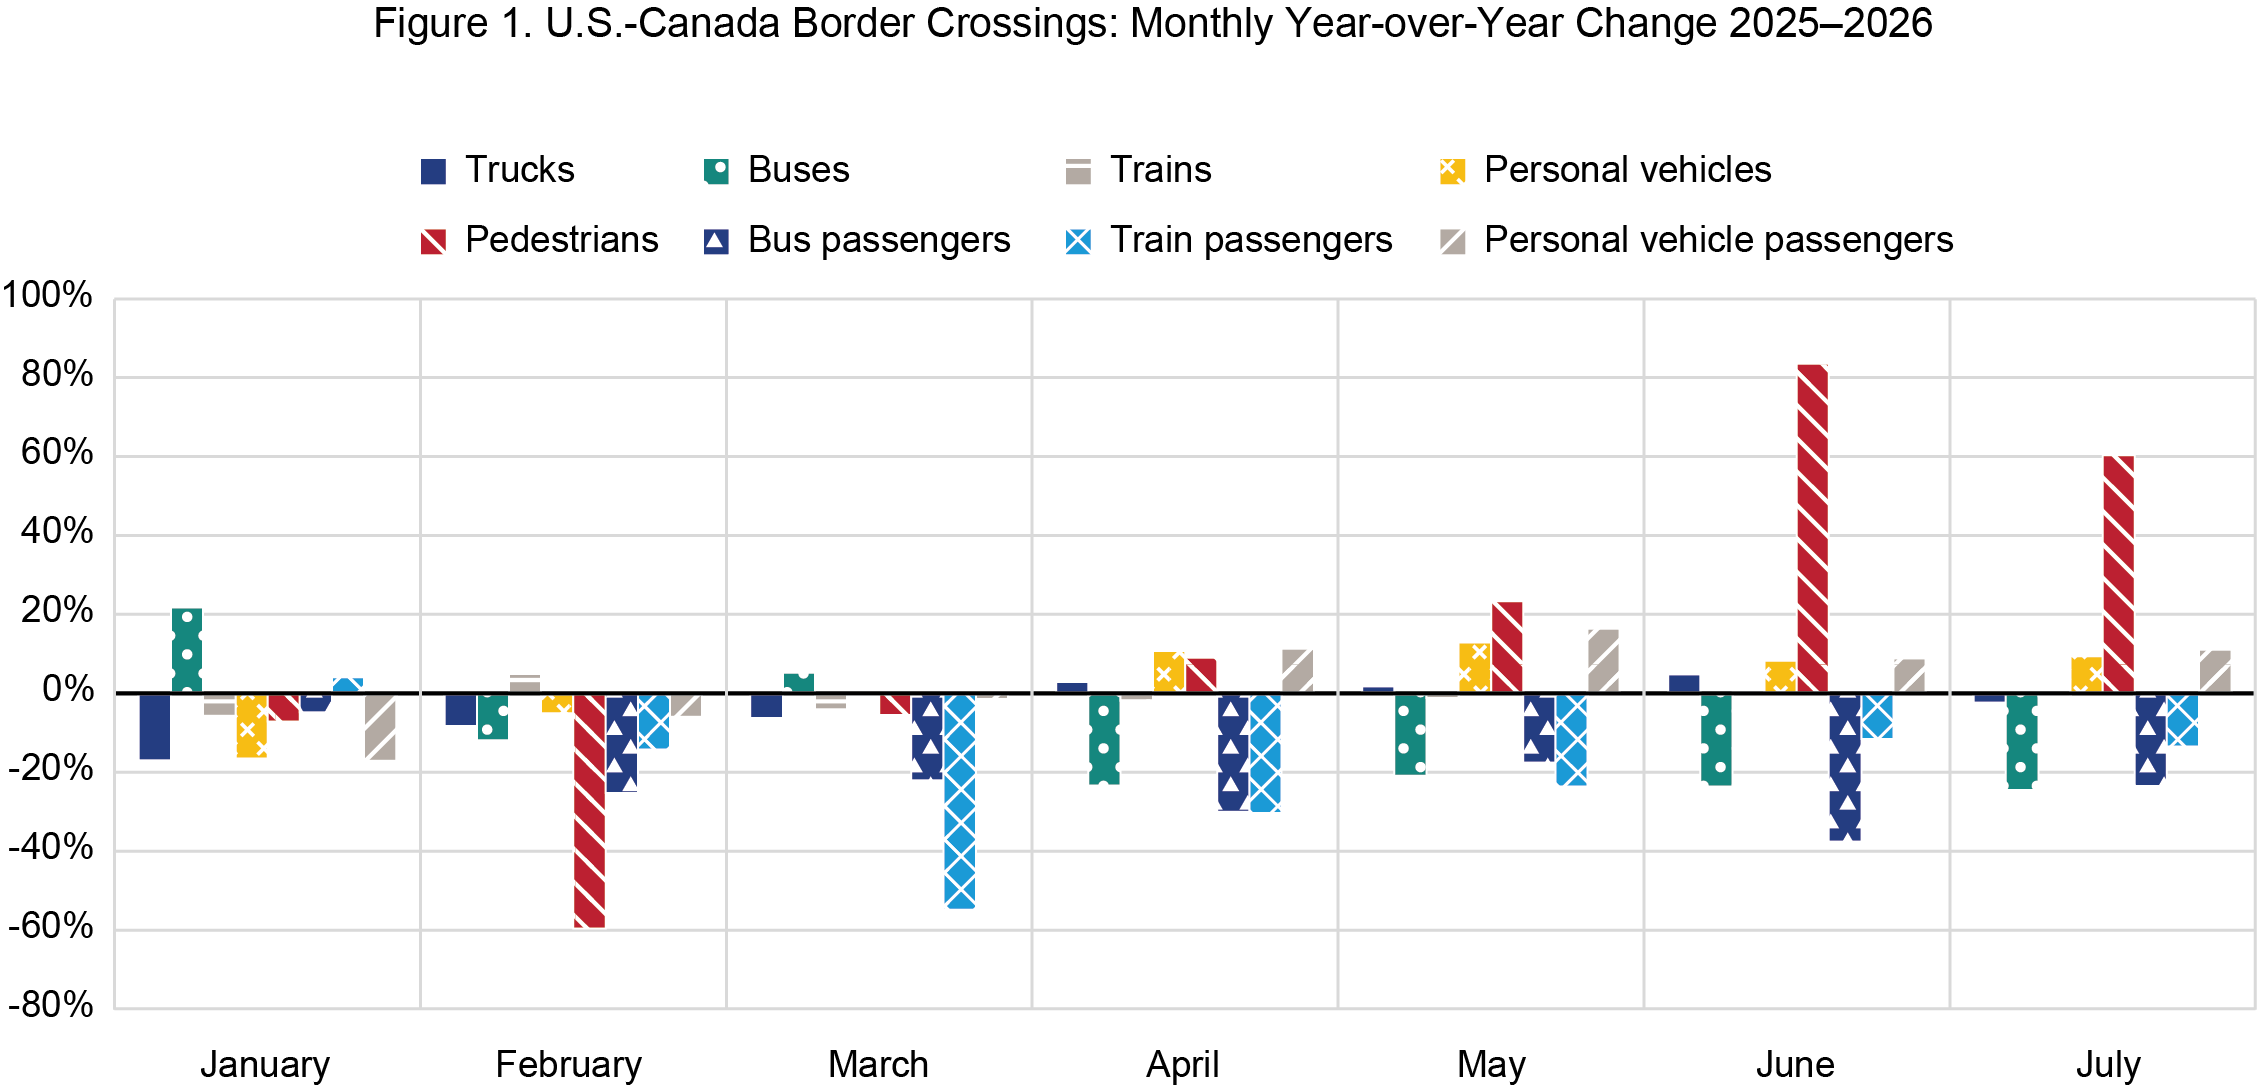
Passenger travel from Canada ran well above 2025 levels through the tournament and in the months leading up to it, as visitors arrived ahead of the opening matches. Personal vehicle crossings from Canada were 7.6% below 2025 levels over the first three months of the year, then rose 10.7% in April and 13.0% in May as arrivals began building. They remained 8.2% above 2025 in June and 9.4% above in July while the tournament was underway, and the passengers they carried rose 8.8% and 11.0% over the same two months. The ports carrying the main corridors to the host cities moved with the border as a whole rather than apart from it. Vehicle crossings in June rose 10.4% at Buffalo Niagara Falls on the corridor to Toronto, 7.4% at Detroit, and 7.6% at the Washington State ports serving Vancouver, against 8.2% border-wide.
Pedestrians entering from Canada rose 23.4% in May and 83.5% in June and are estimated to have remained 60.3% above 2025 levels in July. The increase is concentrated at Buffalo Niagara Falls, the principal pedestrian gateway on the corridor to Toronto, where crossings rose 32.1% in April, 73.6% in May and 168.8% in June. Pedestrian volumes at the remaining northern border ports were below 2025 levels over the same months. Buses entering from Canada fell 24.5% in July and the passengers they carried fell 23.6%, though the decline is concentrated at Skagway, Alaska, a cruise gateway unrelated to the tournament corridors. Excluding that port, bus passengers rose 8.7%, indicating that group travel grew alongside private vehicle crossings.
For full coverage of this data, please visit the border crossing data homepage.
U.S.-Canada Border: Monthly Crossings by Truck 2025-2026
Month | 2025 | 2026 | Percent (%) Change |
|---|---|---|---|
| January | 465,709 | 386,567 | -17.0% |
| February | 428,116 | 392,840 | -8.2% |
| March | 491,971 | 461,210 | -6.3% |
| April | 428,253 | 440,619 | 2.9% |
| May | 433,897 | 441,501 | 1.8% |
| June | 441,096 | 462,159 | 4.8% |
| July | 450,024 | 439,429 | -2.4% |
| August | 424,246 | ||
| September | 454,488 | ||
| October | 459,169 | ||
| November | 408,950 | ||
| December | 381,510 |
U.S.-Canada Border: Monthly Crossings by Buses 2025-2026
| Month | 2025 | 2026 | Percent (%) Change |
|---|---|---|---|
| January | 1,632 | 1,986 | 21.7% |
| February | 2,405 | 2,120 | -11.9% |
| March | 2,179 | 2,294 | 5.3% |
| April | 3,443 | 2,637 | -23.4% |
| May | 4,922 | 3,893 | -20.9% |
| June | 5,580 | 4,264 | -23.6% |
| July | 6,410 | 4,837 | -24.5% |
| August | 6,196 | ||
| September | 5,157 | ||
| October | 4,082 | ||
| November | 2,637 | ||
| December | 2,246 |
U.S.-Canada Border: Monthly Crossings by Trains 2025-2026
| Month | 2025 | 2026 | Percent (%) Change |
|---|---|---|---|
| January | 1,775 | 1,674 | -5.7% |
| February | 1,504 | 1,578 | 4.9% |
| March | 1,884 | 1,807 | -4.1% |
| April | 1,771 | 1,738 | -1.9% |
| May | 1,762 | 1,742 | -1.1% |
| June | 1,624 | 1,627 | -0.2% |
| July | 1,647 | 1,636e | -0.7% |
| August | 1,664 | ||
| September | 1,586 | ||
| October | 1,708 | ||
| November | 1,634 | ||
| December | 1,593 |
U.S.-Canada Border: Monthly Crossings by Personal Vehicles 2025-2026
| Month | 2025 | 2026 | Percent (%) Change |
|---|---|---|---|
| January | 1,441,053 | 1,201,739 | -16.6% |
| February | 1,219,057 | 1,156,784 | -5.1% |
| March | 1,347,969 | 1,344,742 | -0.2% |
| April | 1,255,799 | 1,390,384 | 10.7% |
| May | 1,449,550 | 1,637,495 | 13.0% |
| June | 1,639,816 | 1,774,813 | 8.2% |
| July | 1,942,644 | 2,124,296 | 9.4% |
| August | 2,056,078 | ||
| September | 1,618,590 | ||
| October | 1,590,327 | ||
| November | 1,389,900 | ||
| December | 1,378,175 |
U.S.-Canada Border: Monthly Crossings by Pedestrians 2025-2026
Month | 2025 | 2026 | Percent (%) Change |
|---|---|---|---|
| January | 9,361 | 8,695 | -7.1% |
| February | 7,927 | 3,200 | -59.6% |
| March | 9,194 | 8,680 | -5.6% |
| April | 12,559 | 13,679 | 8.9% |
| May | 15,377 | 18,974 | 23.4% |
| June | 17,767 | 32,600 | 83.5% |
| July | 46,131 | 73,945e | 60.3% |
| August | 60,541 | ||
| September | 38,745 | ||
| October | 42,077 | ||
| November | 36,684 | ||
| December | 12,247 |
U.S.-Canada Border: Monthly Crossings by Bus Passengers 2025-2026
Month | 2025 | 2026 | Percent (%) Change |
|---|---|---|---|
| January | 33,755 | 32,136 | -4.8% |
| February | 46,763 | 34,959 | -25.2% |
| March | 46,079 | 35,907 | -22.1% |
| April | 64,927 | 45,386 | -30.1% |
| May | 90,804 | 74,863 | -17.6% |
| June | 136,416 | 85,102 | -37.6% |
| July | 130,583 | 99,829 | -23.6% |
| August | 143,383 | ||
| September | 104,962 | ||
| October | 79,658 | ||
| November | 45,711 | ||
| December | 42,354 |
U.S.-Canada Border: Monthly Crossings by Train Passengers 2025-2026
Month | 2025 | 2026 | Percent (%) Change |
|---|---|---|---|
| January | 11,409 | 11,865 | 4.0% |
| February | 11,026 | 9,454 | -14.3% |
| March | 13,490 | 6,088 | -54.9% |
| April | 18,215 | 12,684 | -30.4% |
| May | 34,407 | 26,251 | -23.7% |
| June | 42,233 | 37,346 | -11.6% |
| July | 54,529 | 47,165e | -13.5% |
| August | 36,304 | ||
| September | 31,946 | ||
| October | 14,888 | ||
| November | 19,120 | ||
| December | 11,364 |
U.S.-Canada Border: Monthly Crossings by Personal Vehicle Passengers 2025-2026
Month | 2025 | 2026 | Percent (%) Change |
|---|---|---|---|
| January | 2,667,206 | 2,211,012 | -17.1% |
| February | 2,222,613 | 2,090,598 | -5.9% |
| March | 2,519,266 | 2,483,311 | -1.4% |
| April | 2,304,657 | 2,566,797 | 11.4% |
| May | 2,669,938 | 3,108,309 | 16.4% |
| June | 3,177,970 | 3,458,176 | 8.8% |
| July | 4,059,465 | 4,506,146 | 11.0% |
| August | 4,354,330 | ||
| September | 2,943,565 | ||
| October | 2,921,735 | ||
| November | 2,579,014 | ||
| December | 2,690,907 |
Note: “e” indicates an estimated value, for July 2026 and for October 2025, where port reporting for that measure was incomplete. The decline in bus and bus passenger counts on the U.S.-Canada border is concentrated at Skagway, Alaska, which accounts for 93% of the drop in bus crossings from January through July. Excluding Skagway, bus crossings were essentially unchanged from 2025 and bus passengers rose 8.7% in July.
U.S.-Mexico Border: Monthly Crossings by Trucks 2025-2026
Month | 2025 | 2026 | Percent (%) Change |
|---|---|---|---|
| January | 631,090 | 624,253 | -1.1% |
| February | 591,249 | 613,842 | 3.8% |
| March | 662,135 | 674,389 | 1.9% |
| April | 632,437 | 645,972 | 2.1% |
| May | 655,829 | 636,462 | -3.0% |
| June | 639,126 | 646,436 | 1.1% |
| July | 650,521 | 650,466 | -0.0% |
| August | 630,099 | ||
| September | 635,915 | ||
| October | 687,577 | ||
| November | 577,892 | ||
| December | 595,445 |
U.S.-Mexico Border: Monthly Crossings by Buses 2025-2026
Month | 2025 | 2026 | Percent (%) Change |
|---|---|---|---|
| January | 12,053 | 6,650 | -44.8% |
| February | 10,101 | 5,247 | -48.1% |
| March | 10,926 | 6,475 | -40.7% |
| April | 11,484 | 6,506 | -43.3% |
| May | 7,734 | 6,732 | -13.0% |
| June | 10,044 | 6,762 | -32.7% |
| July | 10,640 | 7,496e | -29.5% |
| August | 10,450 | ||
| September | 7,689 | ||
| October | 7,572e | ||
| November | 6,194 | ||
| December | 7,744 |
U.S.-Mexico Border: Monthly Crossings by Trains 2025-2026
Month | 2025 | 2026 | Percent (%) Change |
|---|---|---|---|
| January | 936 | 862 | -7.9% |
| February | 855 | 814 | -4.8% |
| March | 949 | 940 | -0.9% |
| April | 944 | 938 | -0.6% |
| May | 967 | 1,007 | 4.1% |
| June | 936 | 927 | -1.0% |
| July | 964 | 975e | 1.1%e |
| August | 995 | ||
| September | 942 | ||
| October | 965 | ||
| November | 930 | ||
| December | 926 |
U.S.-Mexico Border: Monthly Crossings by Personal Vehicles 2025-2026
Month | 2025 | 2026 | Percent (%) Change |
|---|---|---|---|
| January | 6,344,347 | 6,250,257 | -1.5% |
| February | 5,751,534 | 5,796,493 | 0.8% |
| March | 6,331,480 | 6,543,093 | 3.3% |
| April | 6,271,583 | 6,234,821 | -0.6% |
| May | 6,458,158 | 6,412,075 | -0.7% |
| June | 6,192,410 | 6,075,715 | -1.9% |
| July | 6,339,403 | 6,240,982 | -1.6% |
| August | 6,501,258 | ||
| September | 6,326,722 | ||
| October | 6,578,256 | ||
| November | 6,322,870 | ||
| December | 6,638,187 |
U.S.-Mexico Border: Monthly Crossings by Pedestrians 2025-2026
Month | 2025 | 2026 | Percent (%) Change |
|---|---|---|---|
| January | 3,475,810 | 3,518,908 | 1.2% |
| February | 3,131,874 | 2,962,198 | -5.4% |
| March | 3,252,714 | 3,838,812 | 18.0% |
| April | 3,620,128 | 3,413,583 | -5.7% |
| May | 3,638,472 | 3,771,567 | 3.7% |
| June | 2,941,285 | 3,467,301 | 17.9% |
| July | 3,541,346 | 3,570,046 | 0.8% |
| August | 3,442,485 | ||
| September | 3,405,970 | ||
| October | 3,522,988 | ||
| November | 7,058,836 | ||
| December | 3,708,177 |
U.S.-Mexico Border: Monthly Crossings by Bus Passengers 2025-2026
Month | 2025 | 2026 | Percent (%) Change |
|---|---|---|---|
| January | 211,763 | 160,192 | -24.4% |
| February | 135,801 | 101,428 | -25.3% |
| March | 162,917 | 142,683 | -12.4% |
| April | 175,838 | 144,670 | -17.7% |
| May | 174,827 | 149,113 | -14.7% |
| June | 135,077 | 144,285 | 6.8% |
| July | 204,886 | 209,111e | 2.1%e |
| August | 197,639 | ||
| September | 136,281 | ||
| October | 122,157e | ||
| November | 114,224 | ||
| December | 151,039 |
U.S.-Mexico Border: Monthly Crossings by Train Passengers 2025-2026
Month | 2025 | 2026 | Percent (%) Change |
|---|---|---|---|
| January | 22 | 559 | 2,440.9% |
| February | 20 | 484 | 2,320.0% |
| March | 545 | 590 | 8.3% |
| April | 652 | 670 | 2.8% |
| May | 73 | 9,363 | 12,726.0% |
| June | 735 | 705 | -4.1% |
| July | 642 | 41 | -93.6% |
| August | 656 | ||
| September | 688 | ||
| October | 721 | ||
| November | 1,164 | ||
| December | 526 |
U.S.-Mexico Border: Monthly Crossings by Personal Vehicle Passengers 2025-2026
Month | 2025 | 2026 | Percent (%) Change |
|---|---|---|---|
| January | 11,450,672 | 11,258,432 | -1.7% |
| February | 10,020,490 | 10,068,253 | 0.5% |
| March | 11,214,712 | 11,537,306 | 2.9% |
| April | 11,221,791 | 11,057,998 | -1.5% |
| May | 11,483,698 | 11,502,193 | 0.2% |
| June | 10,949,167 | 10,671,187 | -2.5% |
| July | 11,488,428 | 11,351,508 | -1.2% |
| August | 11,814,601 | ||
| September | 11,111,684 | ||
| October | 11,485,126 | ||
| November | 11,453,889 | ||
| December | 12,175,591 |
Note: “e” indicates an estimated value, for July 2026 and for October 2025, where port reporting for that measure was incomplete. Bus and bus passenger counts on the U.S.-Mexico border reflect a change in reporting at several ports beginning in October 2025, which affects figures from November 2025 onward. Year-over-year comparisons for these measures are not directly comparable across that break.
The BTS Border Crossing Data provide summary statistics for inbound crossings at the U.S.-Canada and the U.S.-Mexico border at the port level. Data are available for trucks, trains, containers, buses, personal vehicles, passengers, and pedestrians. Border crossing data are collected at ports of entry by U.S. Customs and Border Protection (CBP). The data reflect the number of vehicles, containers, passengers, and pedestrians entering the United States through CBP facilities. CBP does not collect comparable data on outbound crossings. BTS also does not collect data about the size or number of seats per bus. Users seeking more detailed data such as outbound counts may therefore want to review information from individual bridge operators, border state governments, or the Mexican and Canadian governments.