
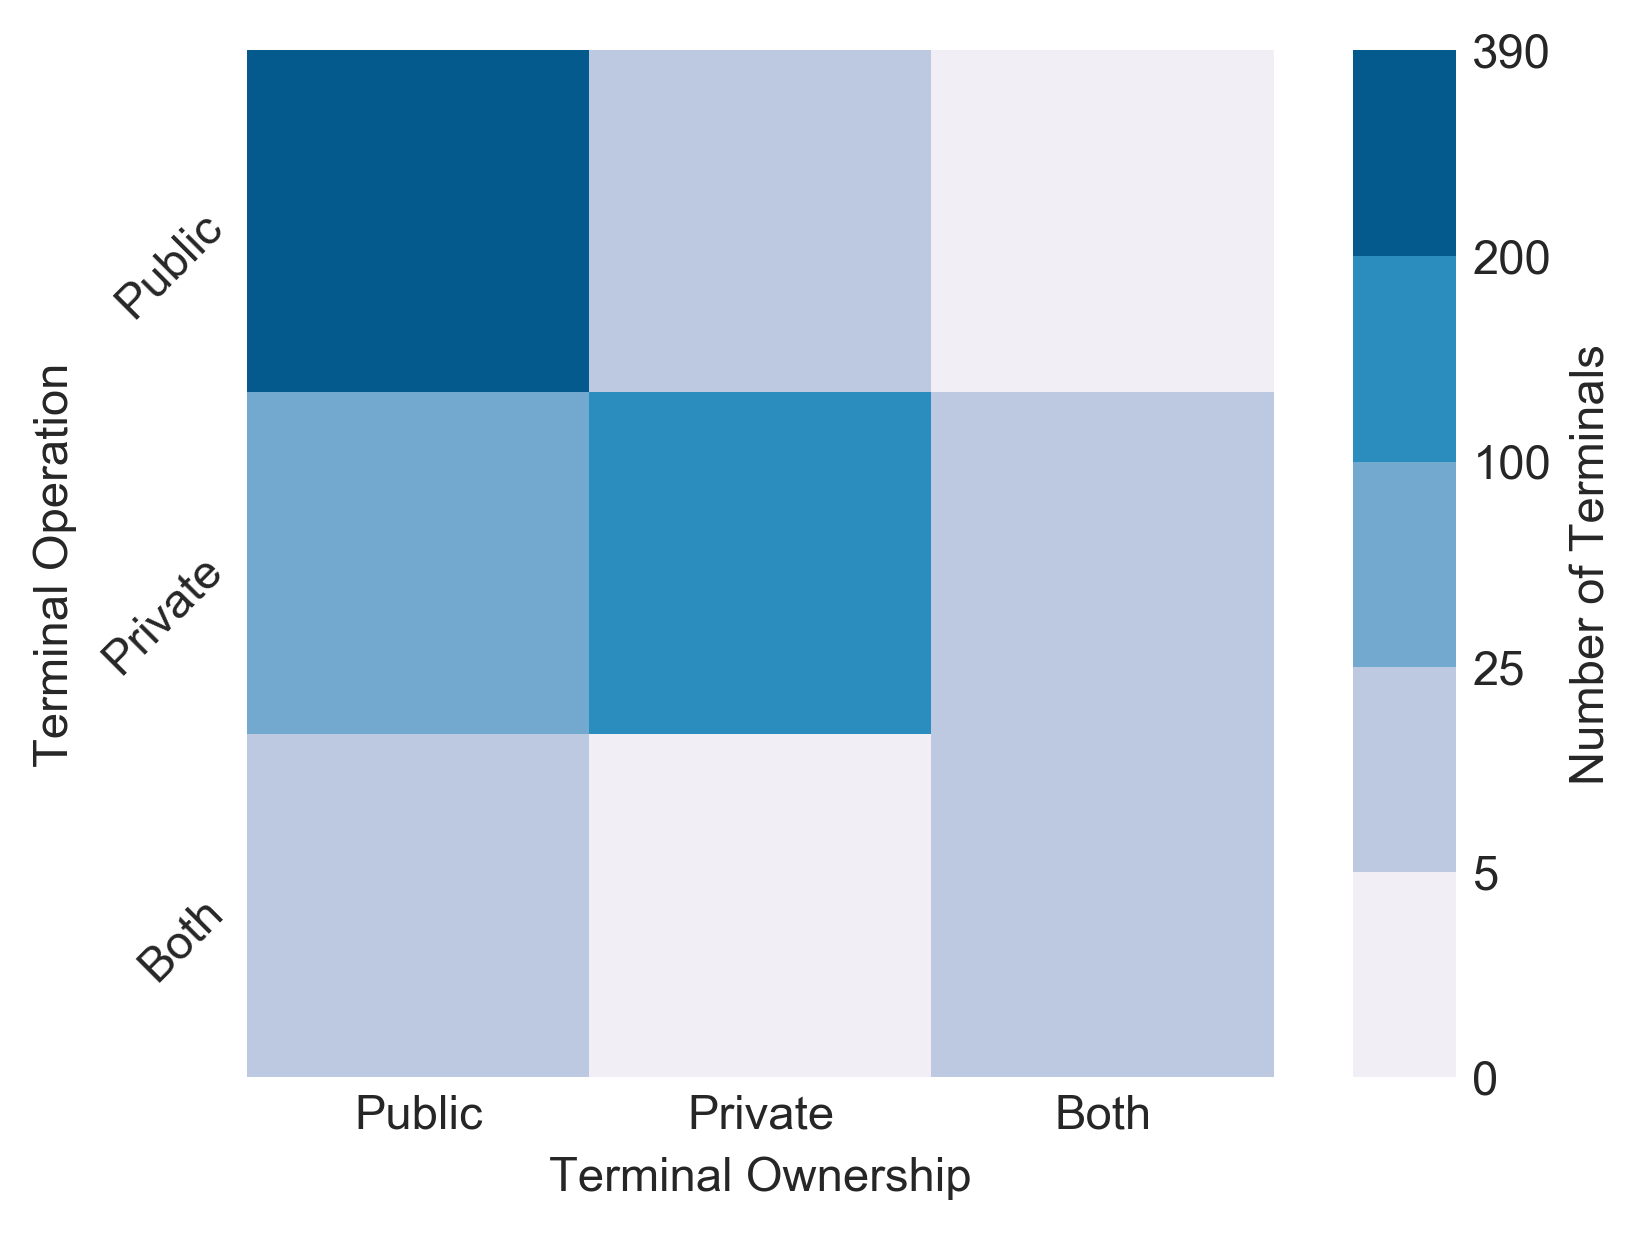
Ferry Terminals by Ownership and Operation (2017)
Figure
Dataset Table:
| Terminal Count (Percentage) | Public Operation | Private Operation | Public and Private Operation | Unknown Operation | Total | 1 |
|---|---|---|---|---|---|---|
| Public Ownership | 366 (60.2%) | 66 (10.9%) | 8 (1.3%) | 0 (0.0%) | 439 (72.2%) | 2 |
| Private Ownership | 6 (1.0%) | 142 (23.4%) | 1 (0.2%) | 0 (0.0%) | 149 (24.5%) | 3 |
| Public and Private Ownserhip | 0 (0.0%) | 7 (1.2%) | 6 (1.0%0 | 0 (0.0%) | 13 (2.1%) | 4 |
| Unknown Ownership | 0 (0.0%) | 0 (0.0%) | 0 (0.0%) | 6 (1.0%) | 0 (0.0%) | 5 |
| Total | 372 (61.2%) | 215 (35.4%) | 15 (2.5%) | 6 (1.0%) | 608 (100.0%) | 6 |
Dataset Excel:
Ferry Terminals by Ownership and Operation (2017).xlsx (8.93 KB)Publications: