
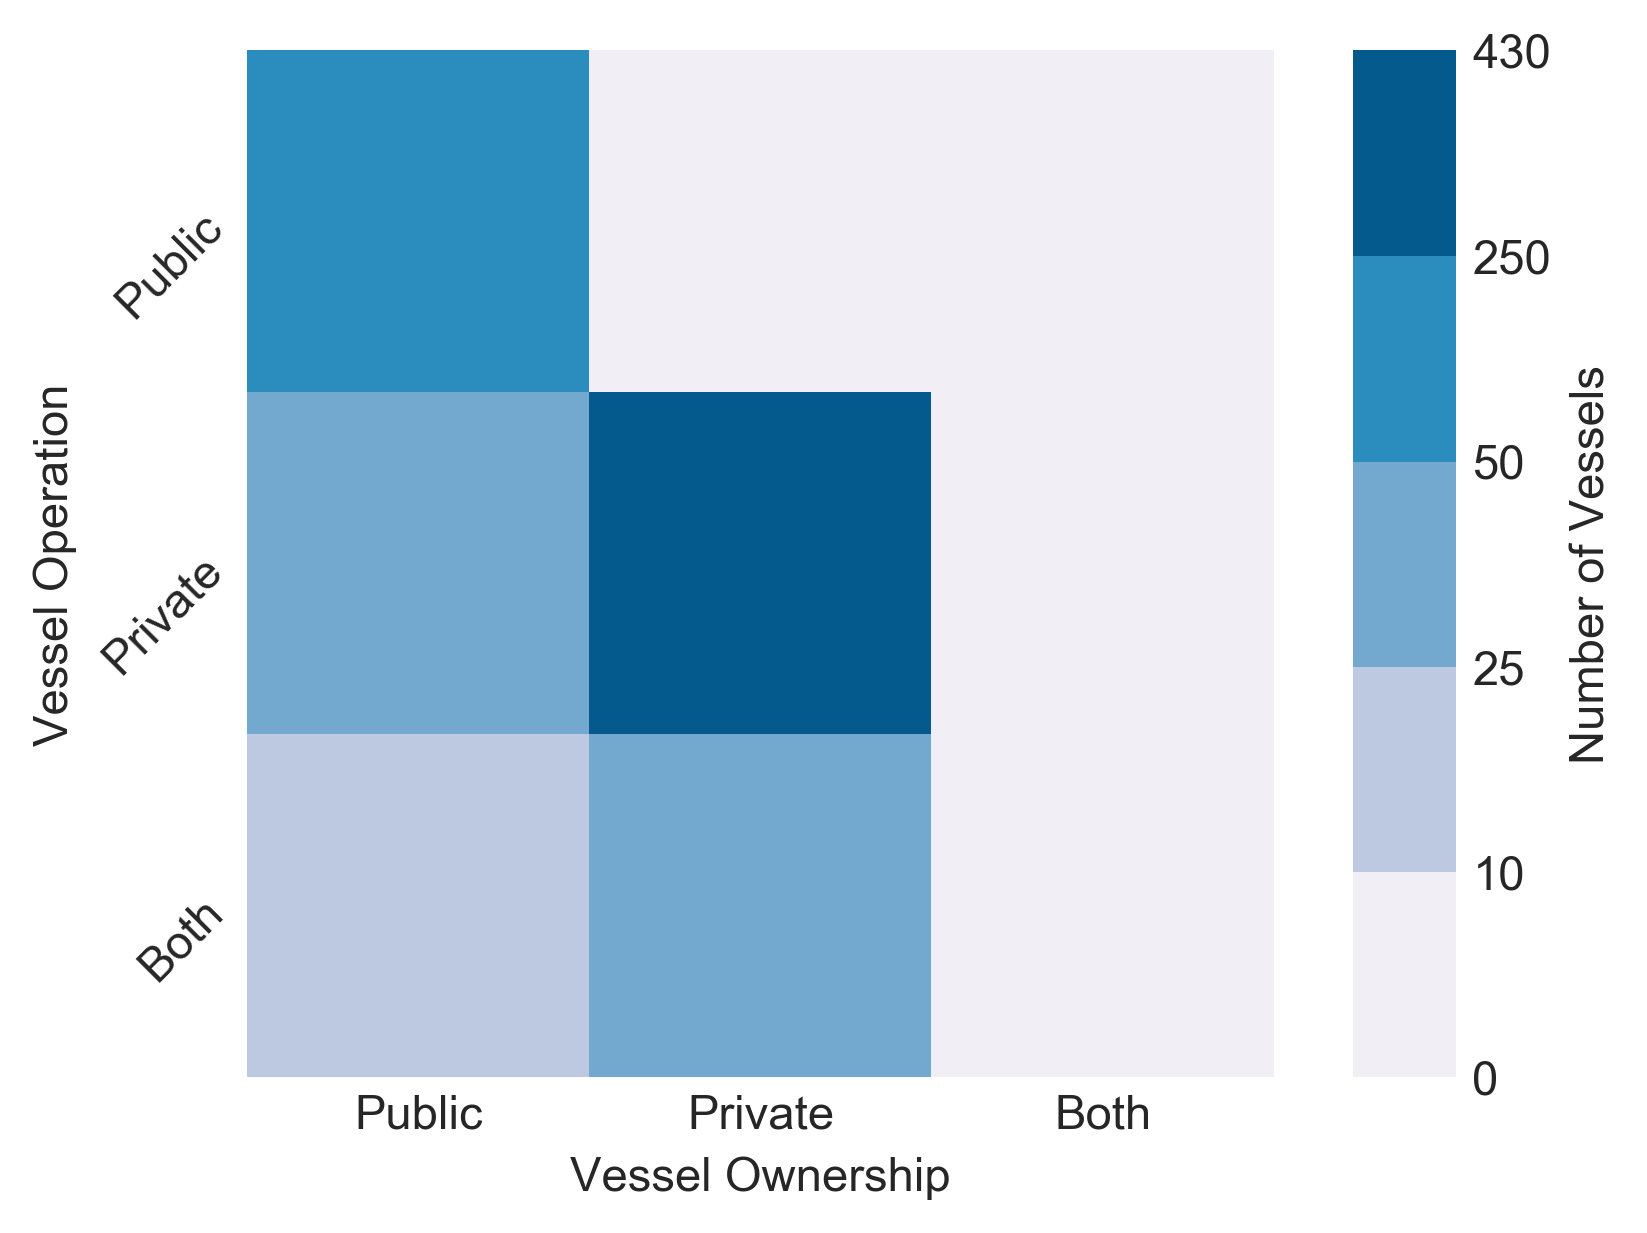
Ferry Vessels by Ownership and Operation
Figure
Dataset Table:
| Vessel Count (Percentage) | Public Operation | Private Operation | Public and Private Operation | Unknown Operation | Total | 1 |
|---|---|---|---|---|---|---|
| Public Ownership | 249 (33.7%) | 27 (3.7%) | 10 (1.4%) | 0 (0.0%) | 286 (38.7%) | 2 |
| Private Ownership | 3 (0.4%) | 427 (57.8%) | 22 (3.0%) | 0 (0.0%) | 452 (61.2%) | 3 |
| Public and Private Ownership | 1 (0.1%) | 0 (0.0%) | 0 (0.0%) | 0 (0.0%) | 1 (0.1%) | 4 |
| Unknown Ownership | 0 (0.0%) | 0 (0.0%) | 0 (0.0%) | 0 (0.0%) | 0 (0.0%) | 5 |
| Total | 253 (34.2%) | 454 (61.4%) | 32 (4.3%) | 0 (0.0%) | 739 (100.0%) | 6 |
Dataset Excel:
Ferry Vessels by Ownership and Operation (2017).xlsx (9.08 KB)Publications: