
Ferry Vessels by State (2017)
Figure
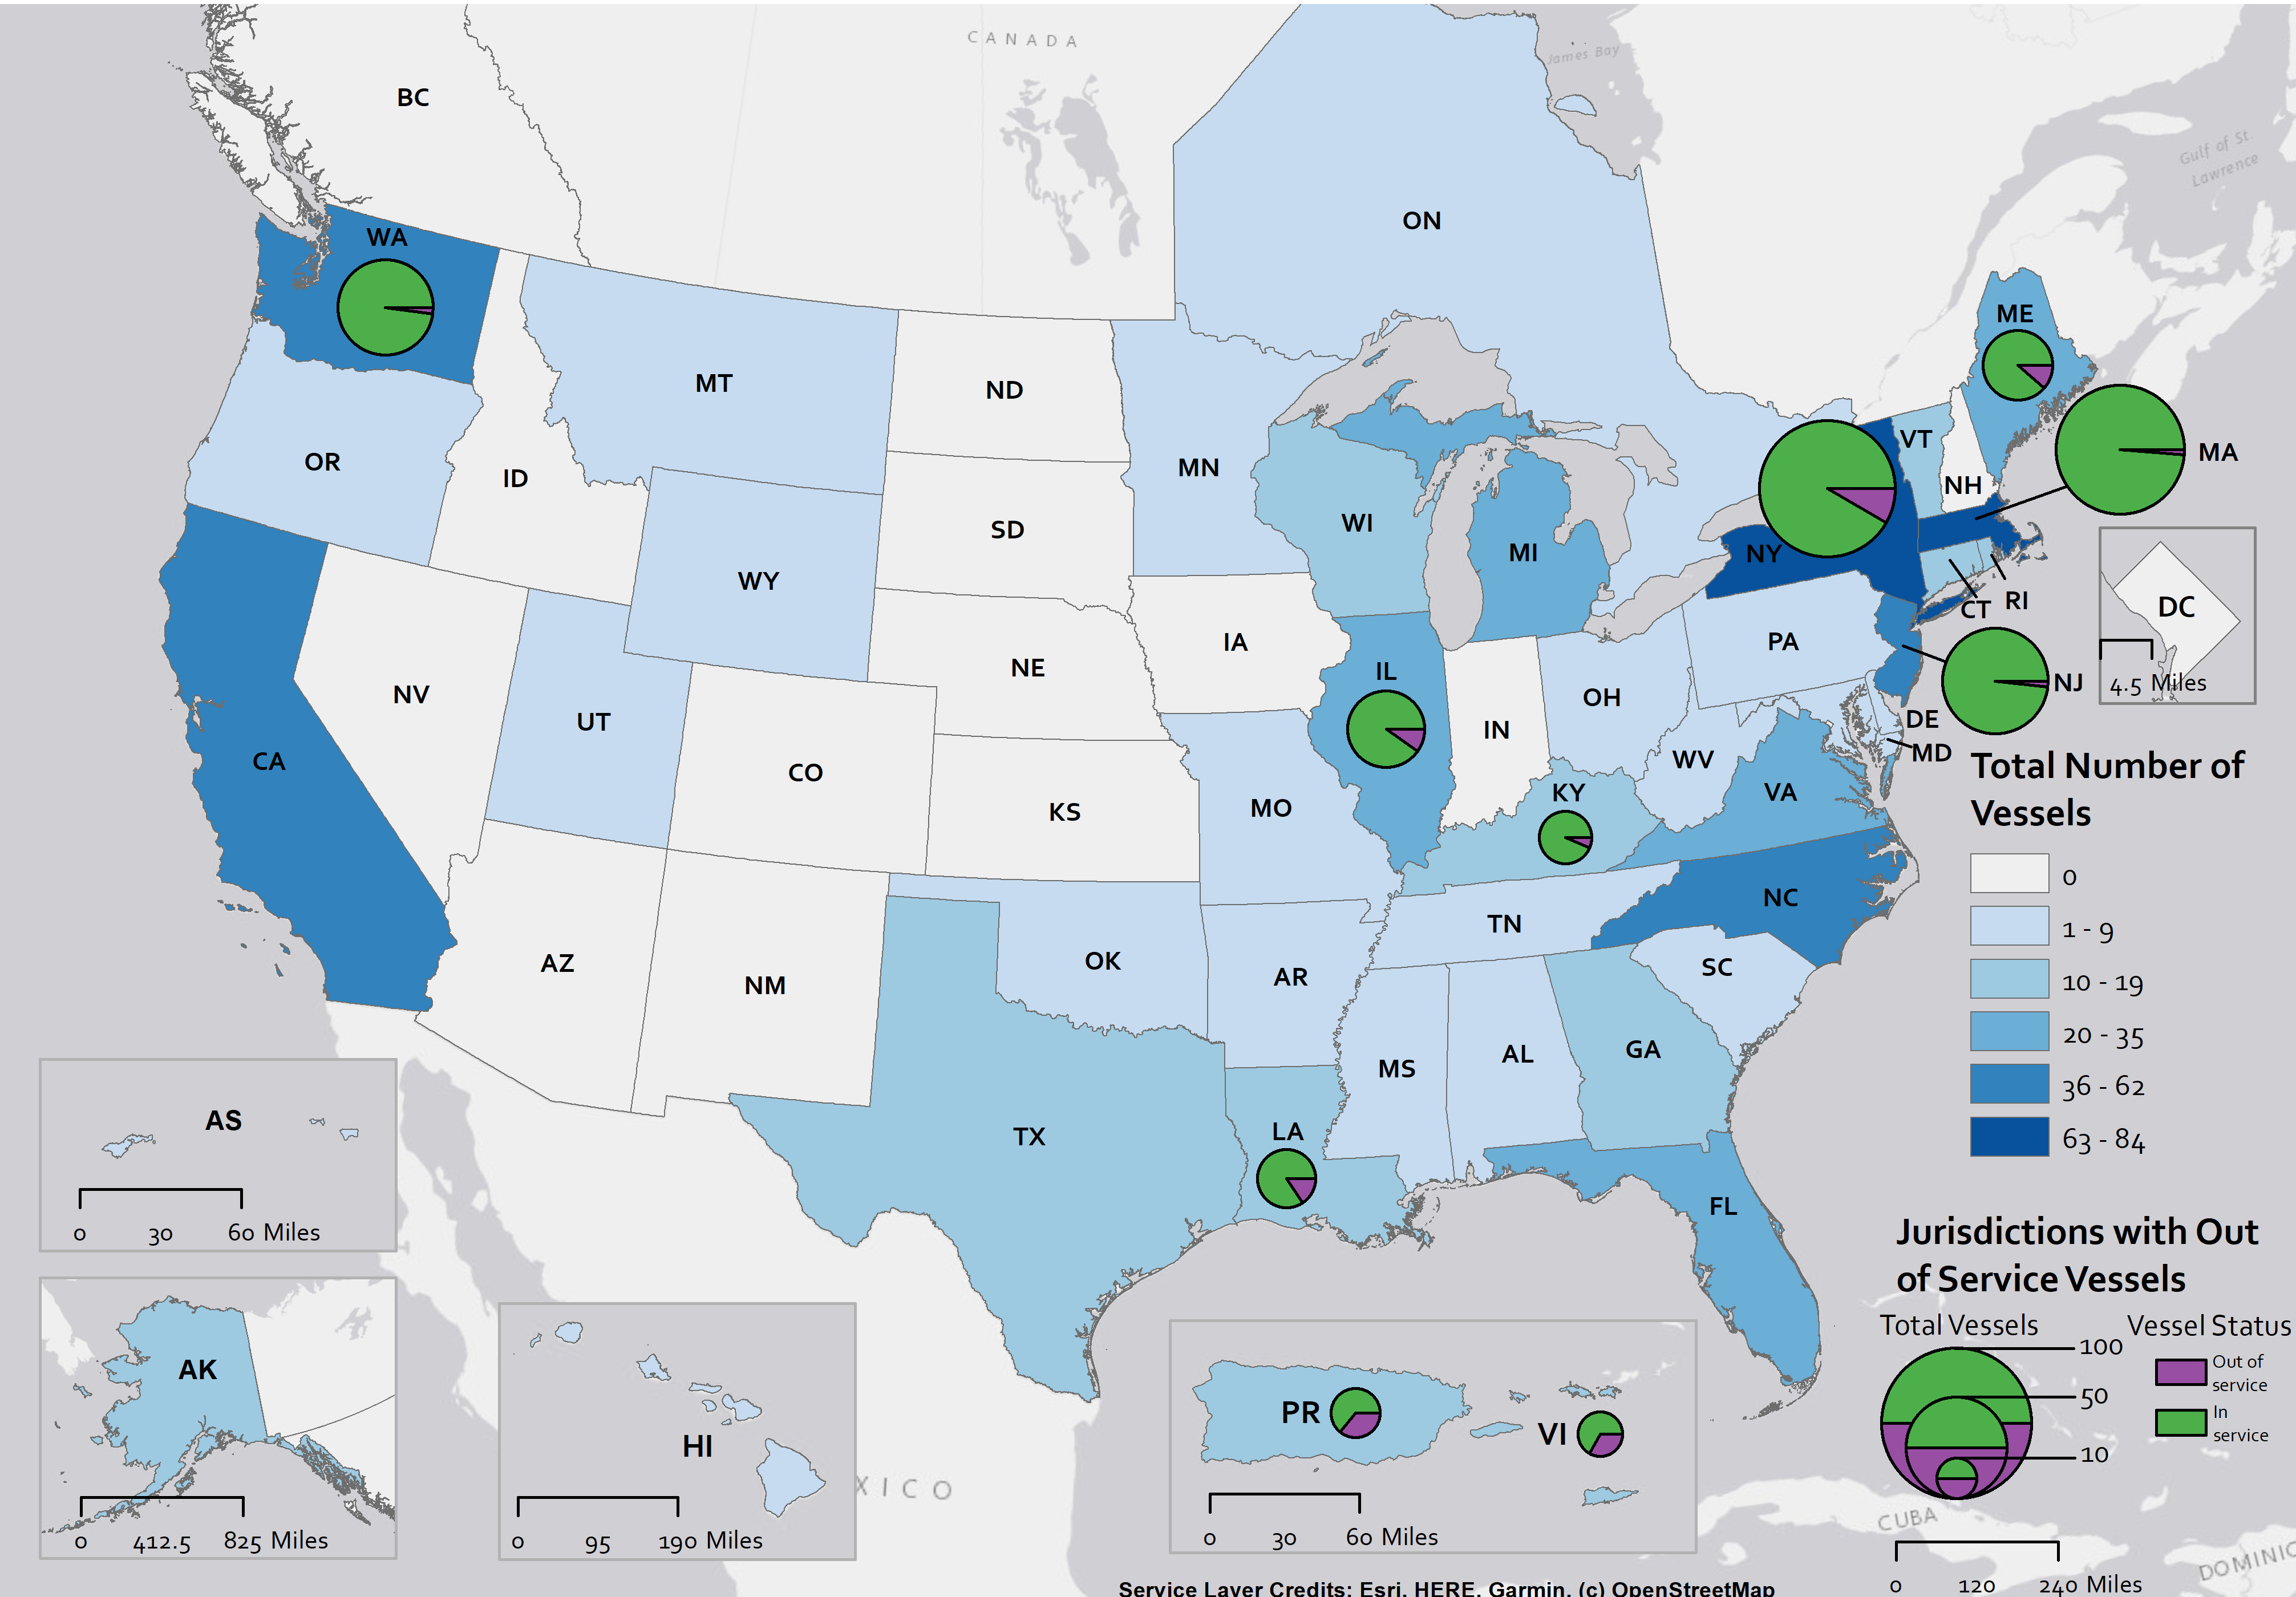
Dataset Table:
| State | Vessel Count | Percent | Vessel In-Service Count | Percent | 1 |
|---|---|---|---|---|---|
| AK | 17 | 2.30% | 17 | 2.30% | 2 |
| AL | 3 | 0.41% | 3 | 0.41% | 3 |
| AR | 4 | 0.54% | 4 | 0.54% | 4 |
| CA | 62 | 8.39% | 62 | 8.39% | 5 |
| CT | 13 | 1.76% | 13 | 1.76% | 6 |
| DE | 1 | 0.14% | 1 | 0.14% | 7 |
| FL | 35 | 4.74% | 35 | 4.74% | 8 |
| GA | 10 | 1.35% | 10 | 1.35% | 9 |
| HI | 5 | 0.68% | 5 | 0.68% | 10 |
| IL | 31 | 4.19% | 28 | 3.79% | 11 |
| KY | 16 | 2.17% | 15 | 2.03% | 12 |
| LA | 19 | 2.57% | 16 | 2.17% | 13 |
| MA | 76 | 10.28% | 75 | 10.15% | 14 |
| MD | 6 | 0.81% | 6 | 0.81% | 15 |
| ME | 26 | 3.52% | 23 | 3.11% | 16 |
| MI | 28 | 3.79% | 28 | 3.79% | 17 |
| MN | 2 | 0.27% | 2 | 0.27% | 18 |
| MO | 5 | 0.68% | 5 | 0.68% | 19 |
| MS | 4 | 0.54% | 4 | 0.54% | 20 |
| MT | 3 | 0.41% | 3 | 0.41% | 21 |
| NC | 43 | 5.82% | 43 | 5.82% | 22 |
| NJ | 54 | 7.31% | 53 | 7.17% | 23 |
| NY | 84 | 11.37% | 77 | 10.42% | 24 |
| OH | 8 | 1.08% | 8 | 1.08% | 25 |
| OK | 3 | 0.41% | 3 | 0.41% | 26 |
| OR | 3 | 0.41% | 3 | 0.41% | 27 |
| PA | 1 | 0.14% | 1 | 0.14% | 28 |
| RI | 12 | 1.62% | 12 | 1.62% | 29 |
| SC | 9 | 1.22% | 9 | 1.22% | 30 |
| TN | 7 | 0.95% | 7 | 0.95% | 31 |
| TX | 17 | 2.30% | 17 | 2.30% | 32 |
| UT | 1 | 0.14% | 1 | 0.14% | 33 |
| VA | 22 | 2.98% | 22 | 2.98% | 34 |
| VT | 12 | 1.62% | 12 | 1.62% | 35 |
| WA | 45 | 6.09% | 44 | 5.95% | 36 |
| WI | 15 | 2.03% | 15 | 2.03% | 37 |
| WV | 2 | 0.27% | 2 | 0.27% | 38 |
| WY | 4 | 0.54% | 4 | 0.54% | 39 |
| U.S. Total | 708 | 95.81% | 688 | 93.10% | 40 |
| AS | 4 | 0.54% | 4 | 0.54% | 41 |
| VI | 12 | 1.62% | 8 | 1.08% | 42 |
| PR | 14 | 1.89% | 9 | 1.22% | 43 |
| U.S. Territories Total | 30 | 4.06% | 21 | 2.84% | 44 |
| ON | 1 | 0.14% | 1 | 0.14% | 45 |
| Non U.S. Total | 1 | 0.14% | 1 | 0.14% | 46 |
| Grand Total | 739 | 100.00% | 710 | 96.08% | 47 |
Dataset Excel:
Ferry Vessels by State (2017).xlsx (11.39 KB)Publications: