
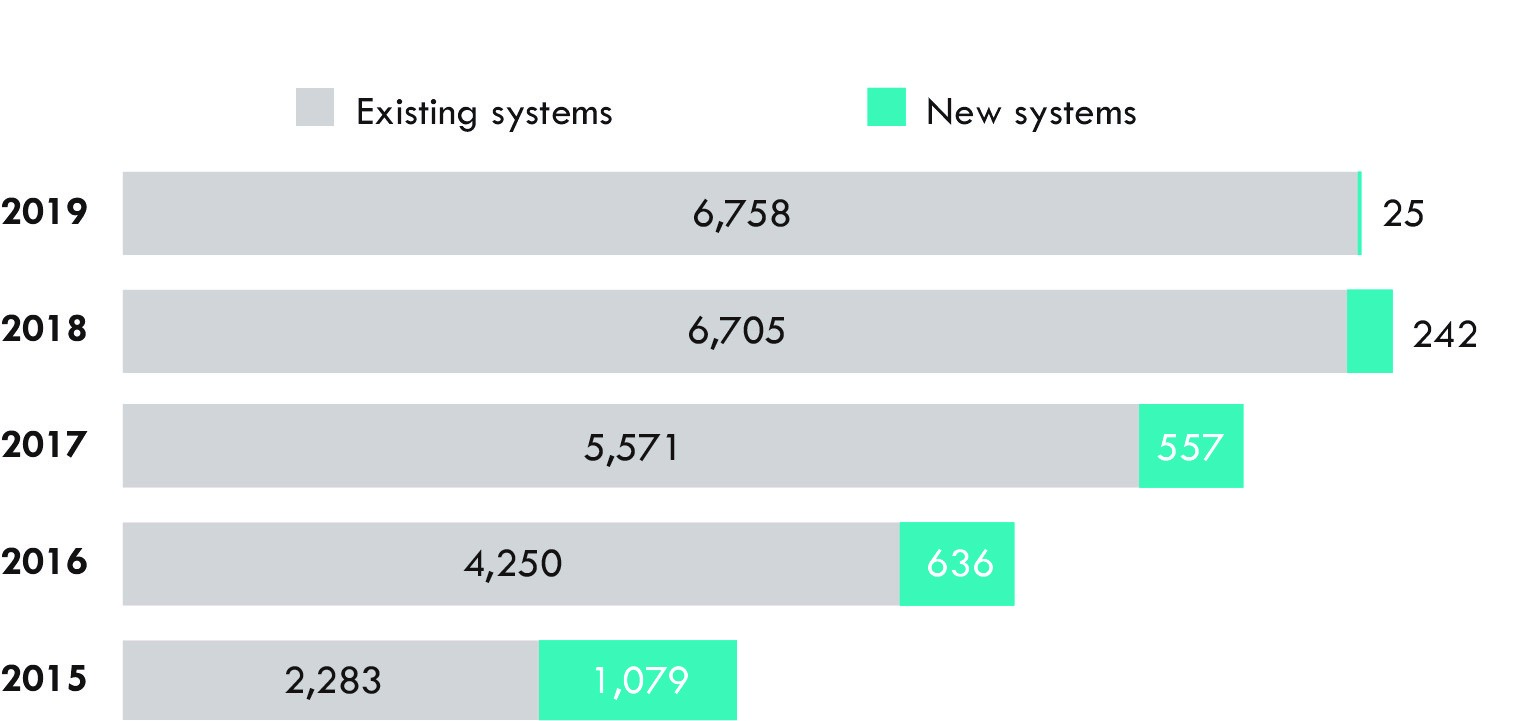
Figure 1: Growth in Docked Bikeshare Systems, 2015-2019
Figure
Dataset Table:
| 2015 | 2016 | 2017 | 2018 | 2019 | 1 | |
|---|---|---|---|---|---|---|
| New systems | 1079 | 636 | 557 | 242 | 25 | 2 |
| Existing systems (net) | 2283 | 4250 | 5571 | 6705 | 6758 | 3 |
| 4 |
Notes:
Number is total at end of year, except 2019. For 2019, number is as of July 2019.
Source:
US Department of Transportation, Bureau of Transportation Statistics, Bikeshare and Scooter Systems, available at https://data-usdot.opendata.arcgis.com/datasets/bikeshare-scooter-systems as of September 2019