
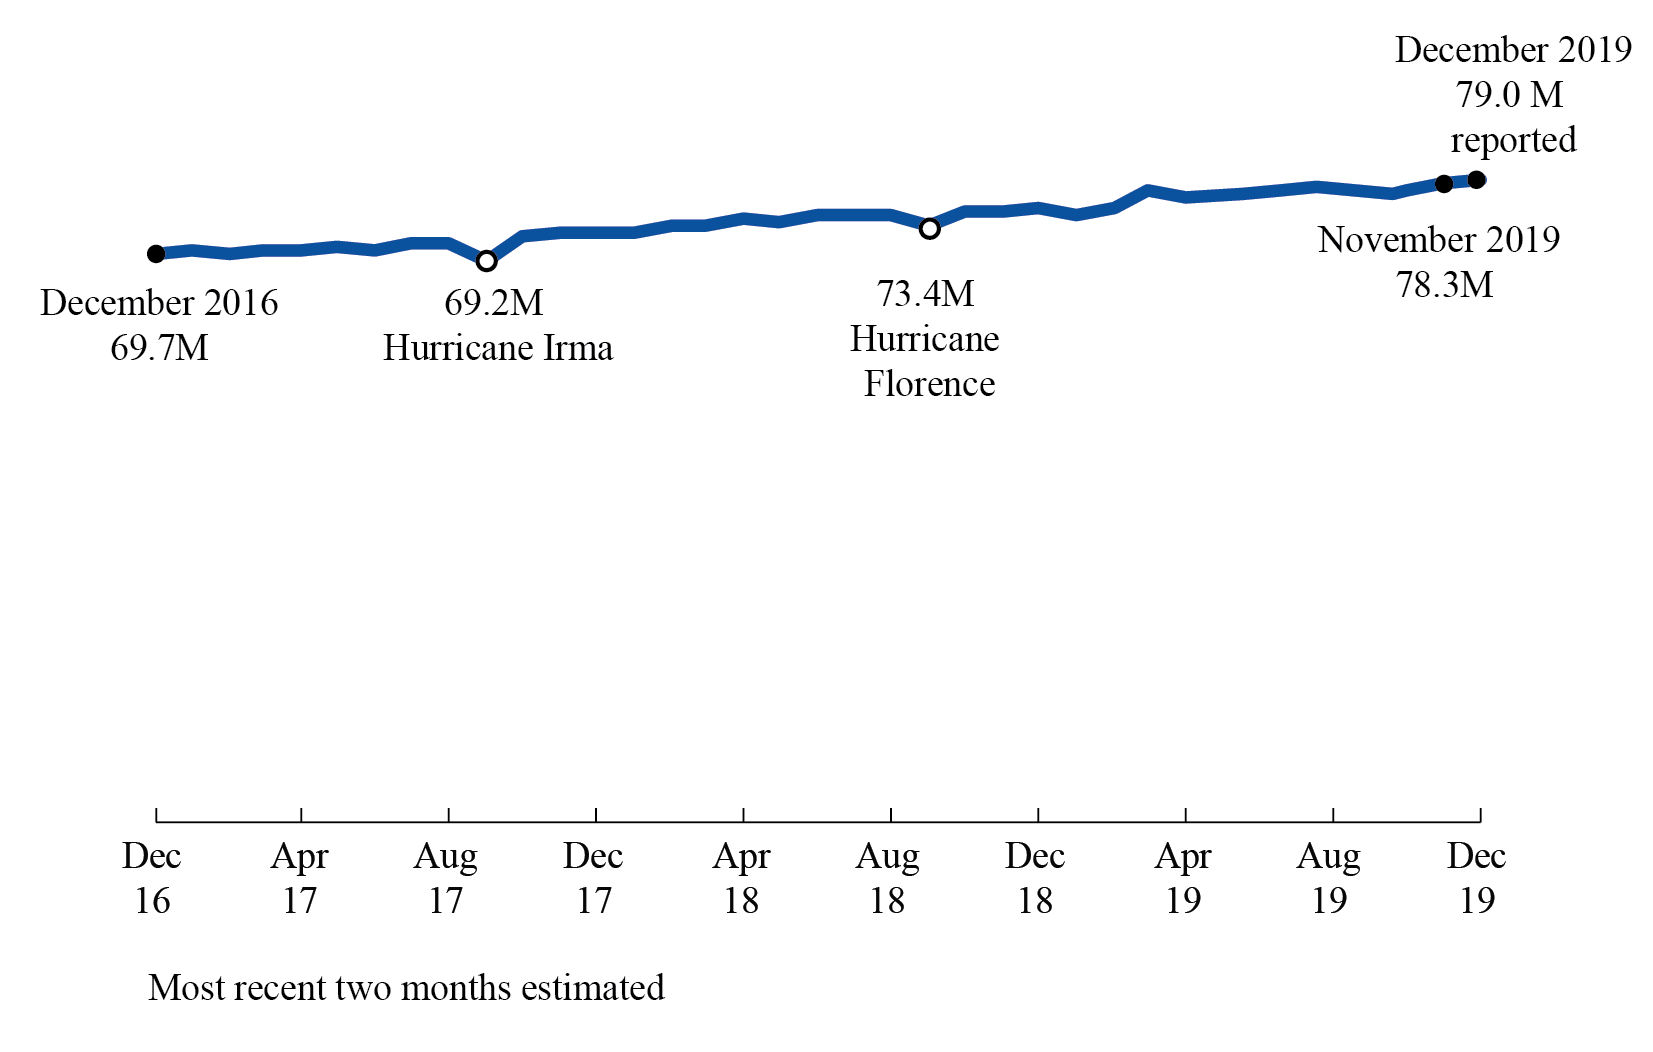
Figure 1. Monthly Passengers on U.S. Scheduled Airlines (Domestic + International), Seasonally Adjusted Dec 2016 - Dec 2019
Figure
Dataset Table:
| Passengers in millions (Seasonally Adjusted) | 1 | ||||
|---|---|---|---|---|---|
| Dec-16 | 69.7 | 2 | |||
| Jan-17 | 70.1 | 3 | |||
| Feb-17 | 69.8 | 4 | |||
| Mar-17 | 70.1 | 5 |