
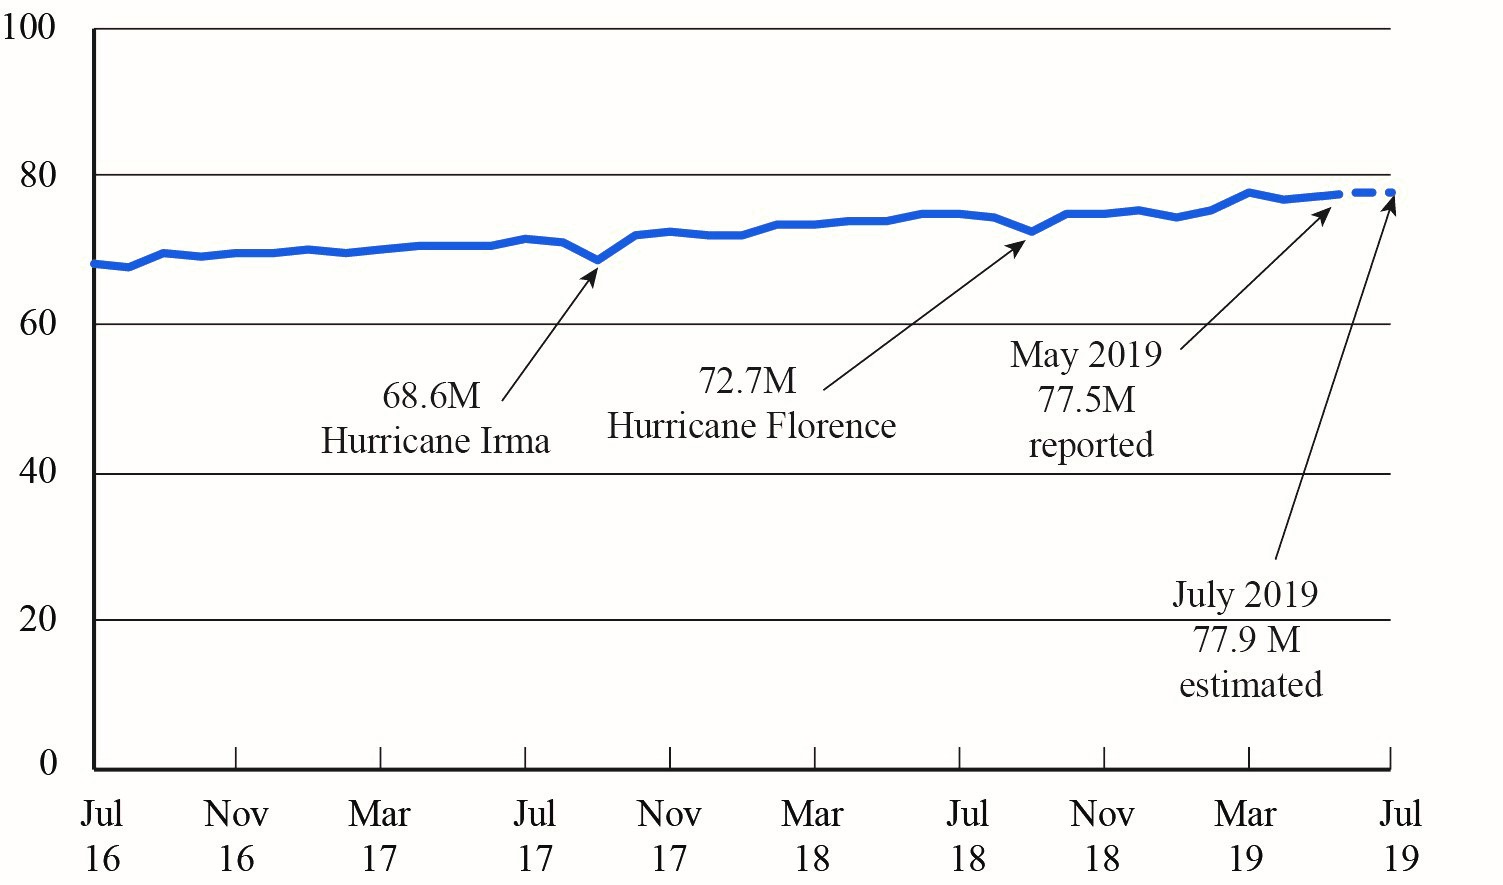
Figure 1. Monthly Passengers on U.S. Scheduled Airlines (Domestic + International), Seasonally Adjusted July 2016 - July 2019 (June 2019-July 2019 estimated)
Passengers in millions (Seasonally Adjusted)
Figure
Dataset Table:
| Passengers in millions (Seasonally Adjusted) | 1 | ||||
|---|---|---|---|---|---|
| Jul-16 | 68.0 | 2 | |||
| Aug-16 | 67.9 | 3 | |||
| Sep-16 | 69.6 | 4 | |||
| Oct-16 | 69.2 | 5 |
Notes:
Most recent two months estimated