
Figure 1. Seasonally-Adjusted Systemwide Passenger Enplanements on All U.S. Scheduled Airlines (Domestic & International), Sept 2015 - Sept 2018 (Aug-Sept 2018 estimated)
Enplanements in millions (Seasonally Adjusted)
Figure
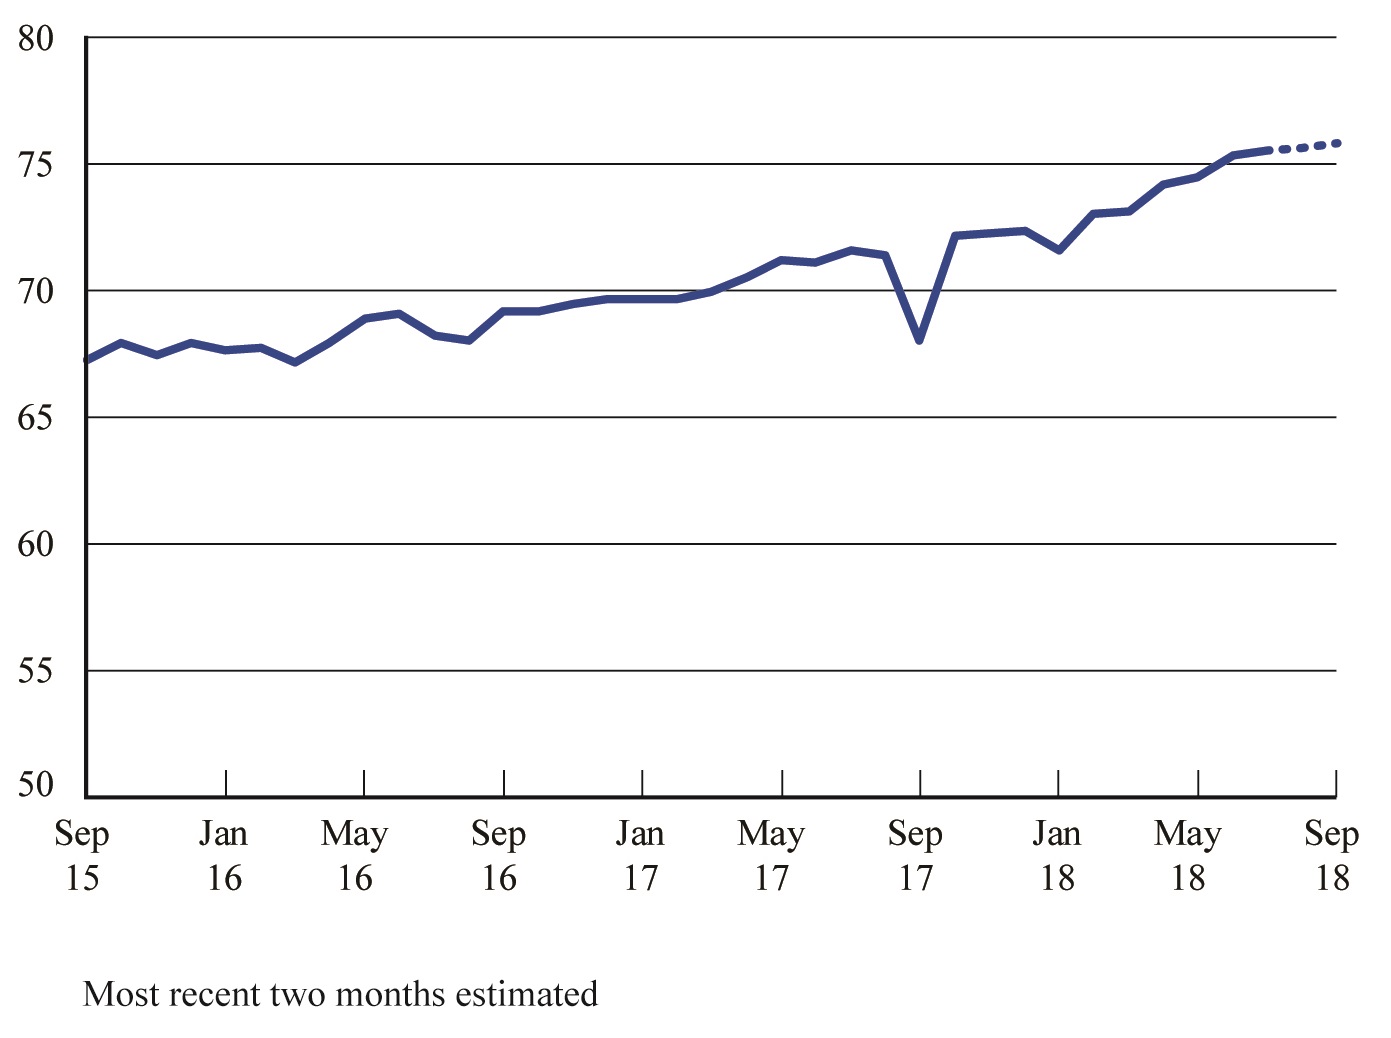
Dataset Table:
| Enplanements in millions (Seasonally Adjusted) | 1 | |
|---|---|---|
| Sep-15 | 67.2 | 2 |
| Oct-15 | 67.9 | 3 |
| Nov-15 | 67.5 | 4 |
| Dec-15 | 68.0 | 5 |
| Jan-16 | 67.7 | 6 |
| Feb-16 | 67.7 | 7 |
| Mar-16 | 67.1 | 8 |
| Apr-16 | 68.0 | 9 |
| May-16 | 68.9 | 10 |
| Jun-16 | 69.1 | 11 |
| Jul-16 | 68.3 | 12 |
| Aug-16 | 68.0 | 13 |
| Sep-16 | 69.2 | 14 |
| Oct-16 | 69.2 | 15 |
| Nov-16 | 69.5 | 16 |
| Dec-16 | 69.6 | 17 |
| Jan-17 | 69.7 | 18 |
| Feb-17 | 69.6 | 19 |
| Mar-17 | 70.0 | 20 |
| Apr-17 | 70.5 | 21 |
| May-17 | 71.2 | 22 |
| Jun-17 | 71.1 | 23 |
| Jul-17 | 71.6 | 24 |
| Aug-17 | 71.4 | 25 |
| Sep-17 | 68.0 | 26 |
| Oct-17 | 72.1 | 27 |
| Nov-17 | 72.3 | 28 |
| Dec-17 | 72.3 | 29 |
| Jan-18 | 71.6 | 30 |
| Feb-18 | 73.0 | 31 |
| Mar-18 | 73.2 | 32 |
| Apr-18 | 74.2 | 33 |
| May-18 | 74.4 | 34 |
| Jun-18 | 75.3 | 35 |
| Jul-18 | 75.6 | 36 |
| Aug-18 | 75.6 | 37 |
| Sep-18 | 75.8 | 38 |
| 39 |
Notes:
Most recent two months estimated