
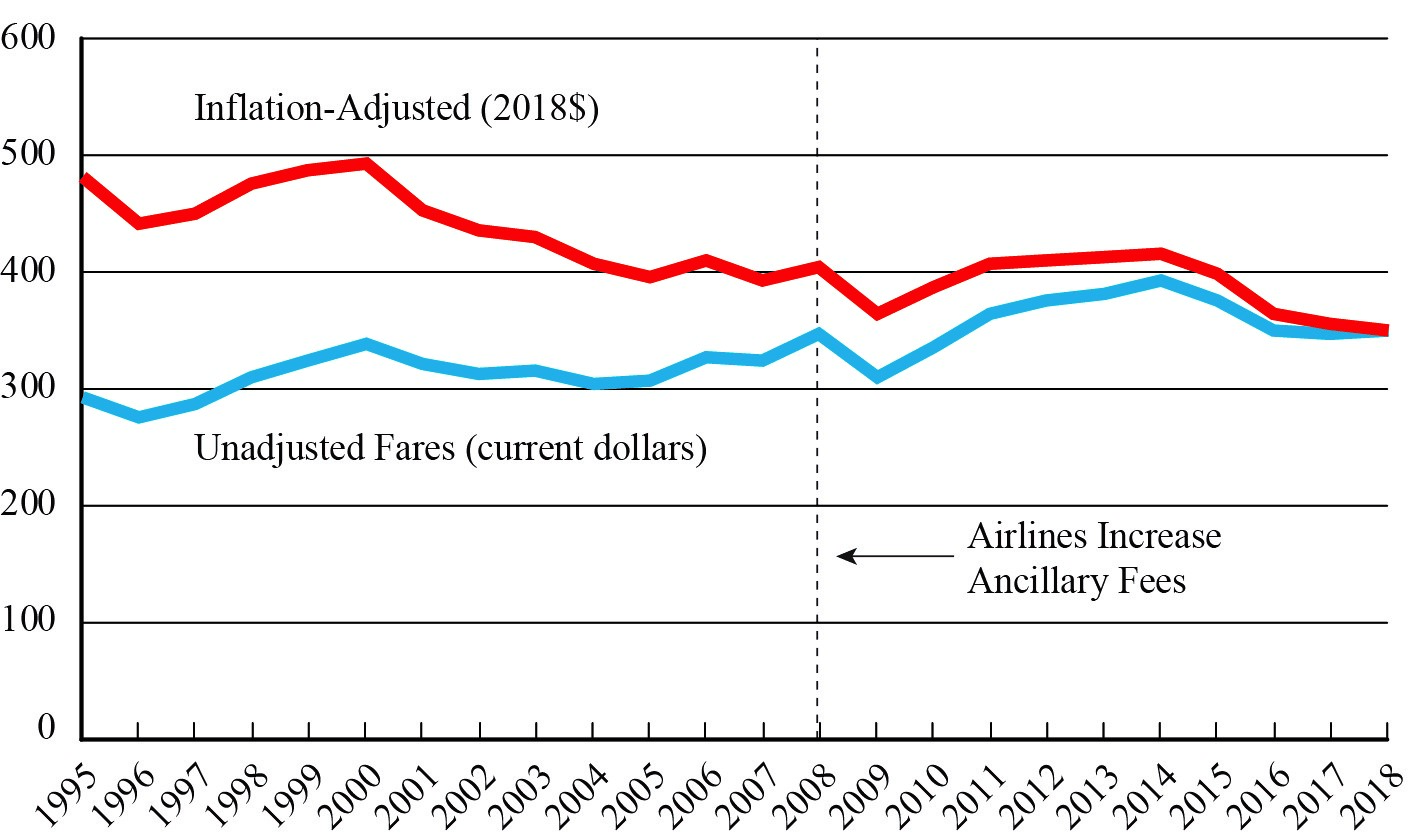
Figure 1. U.S. Average Domestic Annual Fares, 1995-2018
Figure
Dataset Table:
| Unadjusted Fares (current dollars) | Inflation-Adjusted (2018 $) | 1 | |
|---|---|---|---|
| 1995 | 292 | 481 | 2 |
| 1996 | 277 | 443 | 3 |
| 1997 | 287 | 449 | 4 |
| 1998 | 309 | 476 | 5 |
| 1999 | 324 | 488 | 6 |
| 2000 | 339 | 494 | 7 |
| 2001 | 321 | 455 | 8 |
| 2002 | 312 | 436 | 9 |
| 2003 | 315 | 430 | 10 |
| 2004 | 305 | 406 | 11 |
| 2005 | 307 | 395 | 12 |
| 2006 | 329 | 409 | 13 |
| 2007 | 325 | 394 | 14 |
| 2008 | 346 | 404 | 15 |
| 2009 | 310 | 363 | 16 |
| 2010 | 336 | 387 | 17 |
| 2011 | 364 | 406 | 18 |
| 2012 | 375 | 410 | 19 |
| 2013 | 382 | 412 | 20 |
| 2014 | 392 | 416 | 21 |
| 2015 | 377 | 399 | 22 |
| 2016 | 349 | 365 | 23 |
| 2017 | 348 | 356 | 24 |
| 2018 | 350 | 350 | 25 |
| 26 |
Source:
Bureau of Transportation Statistics, Origin and Destination Survey