
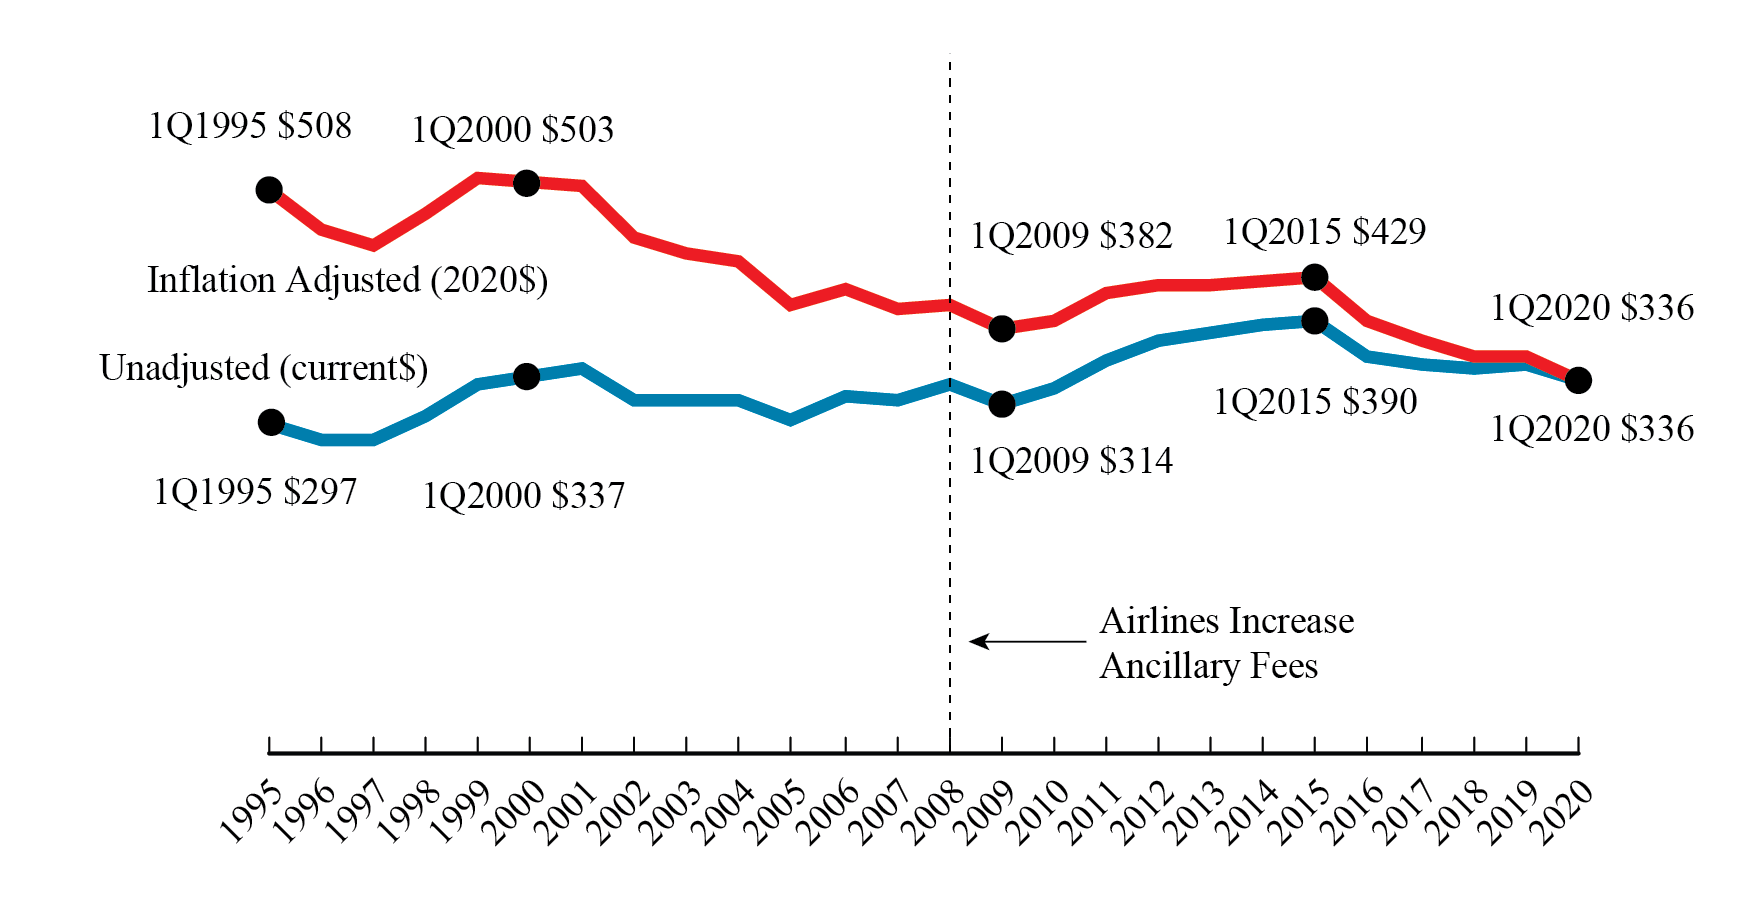
Figure 1. U.S. Average Domestic Fares, 1st Quarter 1995-2020, 1Q 2020
Figure
Dataset Table:
| Figure 1. U.S. Average Domestic Fares, 1st Quarter 1995-2020 | 1 | ||
|---|---|---|---|
| Unadjusted Fares (current dollars) | Inflation-Adjusted (2020$) | 2 | |
| 1995 | 297 | 508 | 3 |
| 1996 | 284 | 473 | 4 |
| 1997 | 283 | 459 | 5 |
| 1998 | 305 | 486 | 6 |
| 1999 | 332 | 520 | 7 |
| 2000 | 340 | 517 | 8 |
| 2001 | 348 | 511 | 9 |
| 2002 | 320 | 465 | 10 |
| 2003 | 319 | 450 | 11 |
| 2004 | 320 | 444 | 12 |
| 2005 | 301 | 406 | 13 |
| 2006 | 323 | 420 | 14 |
| 2007 | 318 | 403 | 15 |
| 2008 | 333 | 406 | 16 |
| 2009 | 314 | 382 | 17 |
| 2010 | 328 | 390 | 18 |
| 2011 | 356 | 414 | 19 |
| 2012 | 373 | 422 | 20 |
| 2013 | 378 | 422 | 21 |
| 2014 | 387 | 426 | 22 |
| 2015 | 390 | 429 | 23 |
| 2016 | 359 | 391 | 24 |
| 2017 | 349 | 371 | 25 |
| 2018 | 346 | 360 | 26 |
| 2019 | 350 | 358 | 27 |
| 2020 | 336 | 336 | 28 |
| 29 |
Source:
Bureau of Transportation Statistics, Origin and Destination Survey