
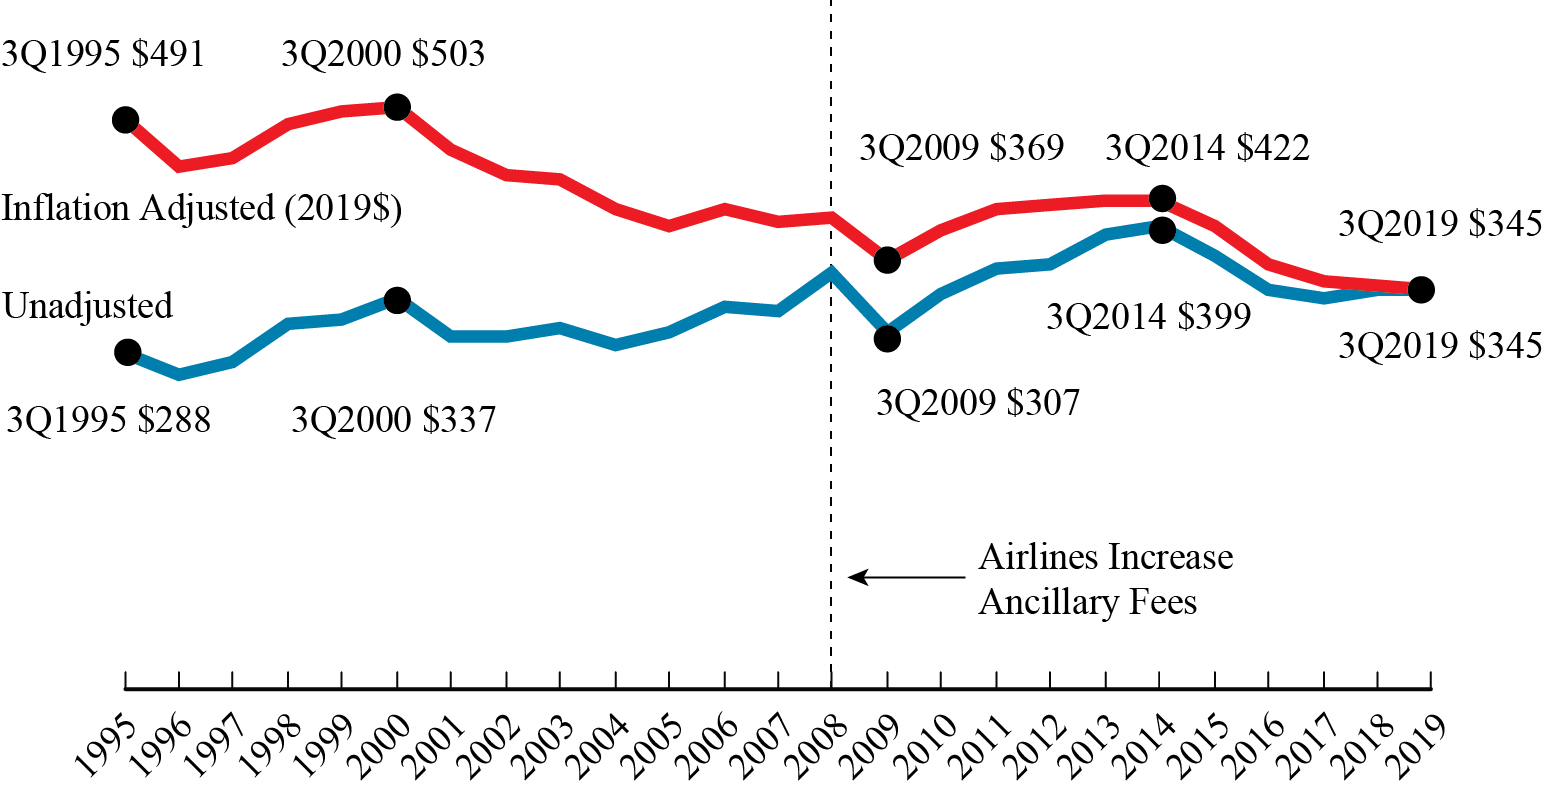
Figure 1. U.S. Average Domestic Fares, 3rd Quarter 1995-2019
Figure
Dataset Table:
| Unadjusted Fares (current dollars) | Inflation-Adjusted (2019$) | 1 | |
|---|---|---|---|
| 1995 | 288 | 491 | 2 |
| 1996 | 269 | 451 | 3 |
| 1997 | 282 | 458 | 4 |
| 1998 | 315 | 486 | 5 |
| 1999 | 317 | 497 | 6 |
| 2000 | 337 | 503 | 7 |
| 2001 | 303 | 463 | 8 |
| 2002 | 303 | 444 | 9 |
| 2003 | 312 | 438 | 10 |
| 2004 | 297 | 413 | 11 |
| 2005 | 306 | 401 | 12 |
| 2006 | 330 | 414 | 13 |
| 2007 | 328 | 401 | 14 |
| 2008 | 359 | 405 | 15 |
| 2009 | 307 | 369 | 16 |
| 2010 | 340 | 395 | 17 |
| 2011 | 361 | 412 | 18 |
| 2012 | 367 | 416 | 19 |
| 2013 | 392 | 419 | 20 |
| 2014 | 399 | 422 | 21 |
| 2015 | 374 | 400 | 22 |
| 2016 | 345 | 366 | 23 |
| 2017 | 336 | 351 | 24 |
| 2018 | 343 | 349 | 25 |
| 2019 | 345 | 345 | 26 |
| 27 |
Source:
Source: Bureau of Transportation Statistics, Origin and Destination Survey