
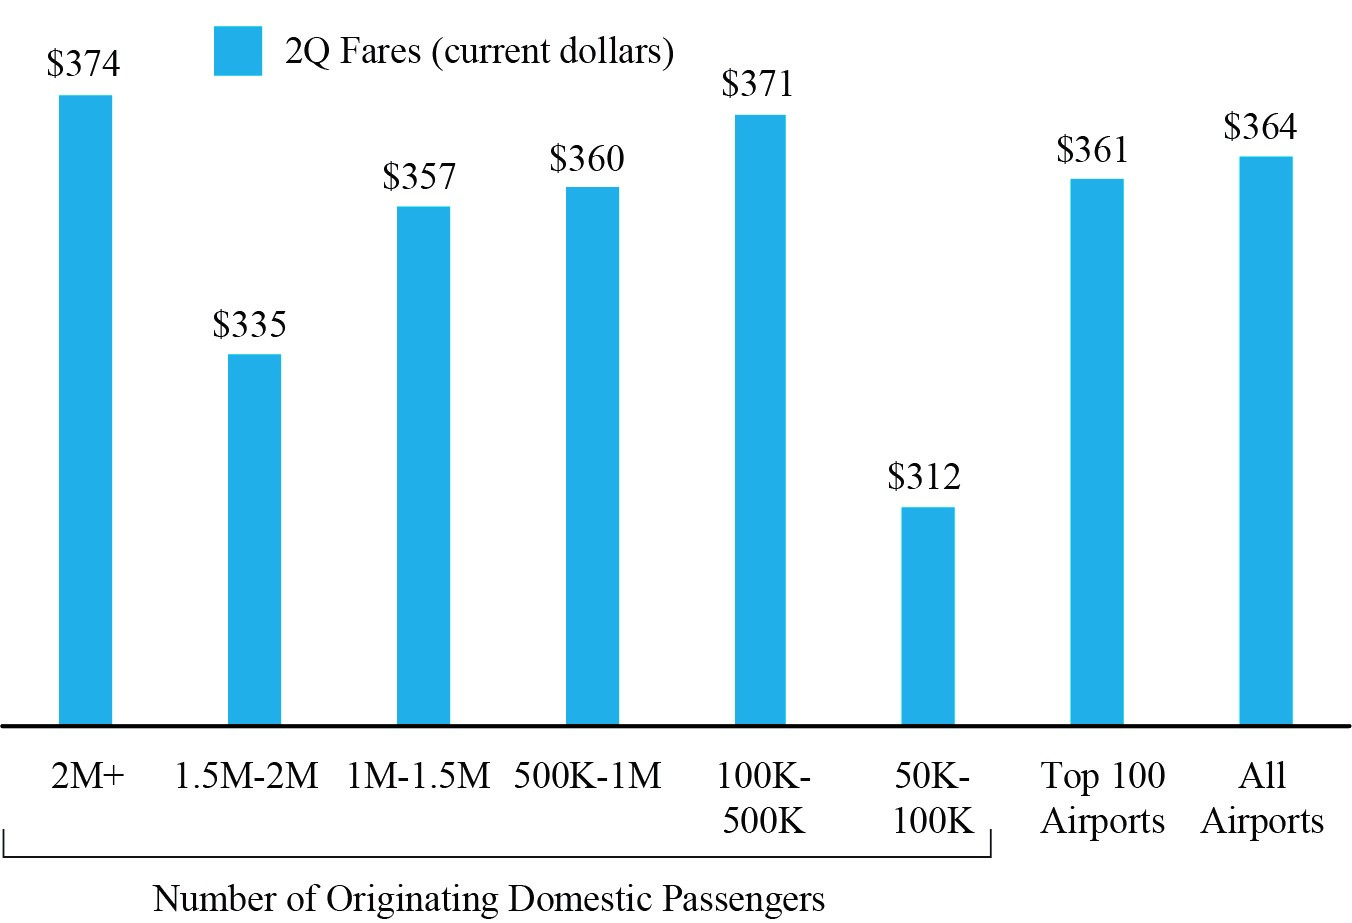
Figure 2. Fares by Airport Group based on Number of Originating Domestic Passengers 2Q 2019
2Q Fares (current dollars)
Figure
Dataset Table:
| Originating Domestic Passengers | 2Q Fares (current dollars) | 1 |
|---|---|---|
| 2M+ | 374 | 2 |
| 1.5M-2M | 335 | 3 |
| 1M-1.5M | 357 | 4 |
| 500K-1M | 360 | 5 |
| 100K-500K | 371 | 6 |
| 50K-100K | 312 | 7 |
| Top 100 Airports | 361 | 8 |
| All Airports | 364 | 9 |
| 10 |
Source:
Bureau of Transportation Statistics, Origin and Destination Survey