
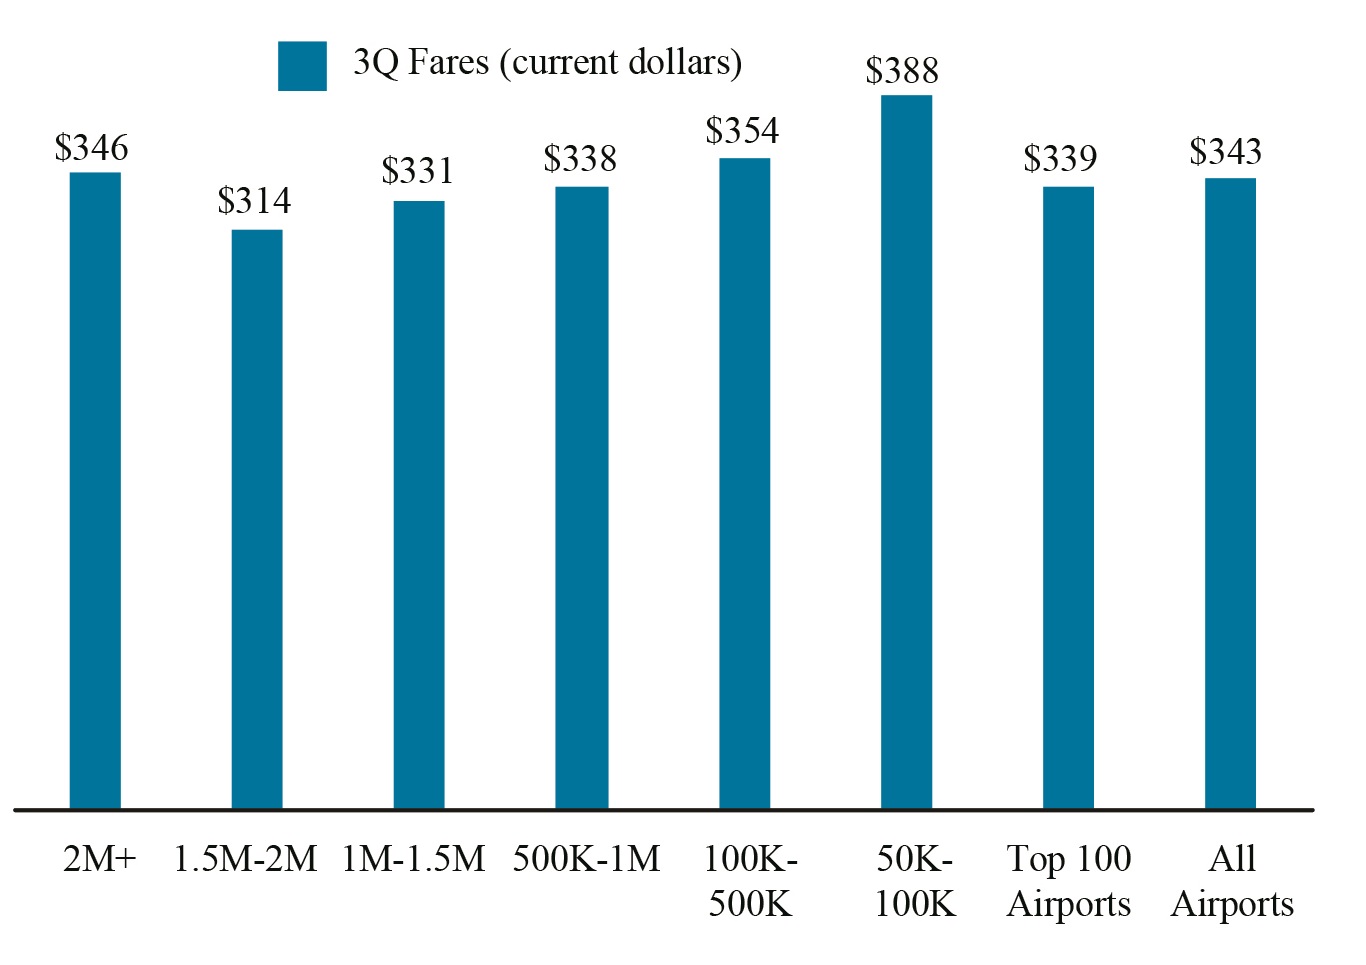
Figure 2. Fares by Airport Group based on Number of Originating Domestic Passengers 3Q 2018
Figure
Dataset Table:
| Originating Domestic Passengers | 3Q Fares (current dollars) | 1 | |||
|---|---|---|---|---|---|
| 2M+ | 346 | 2 | |||
| 1.5M-2M | 314 | 3 | |||
| 1M-1.5M | 331 | 4 | |||
| 500K-1M | 338 | 5 |
Source:
Bureau of Transportation Statistics, Origin and Destination Survey