
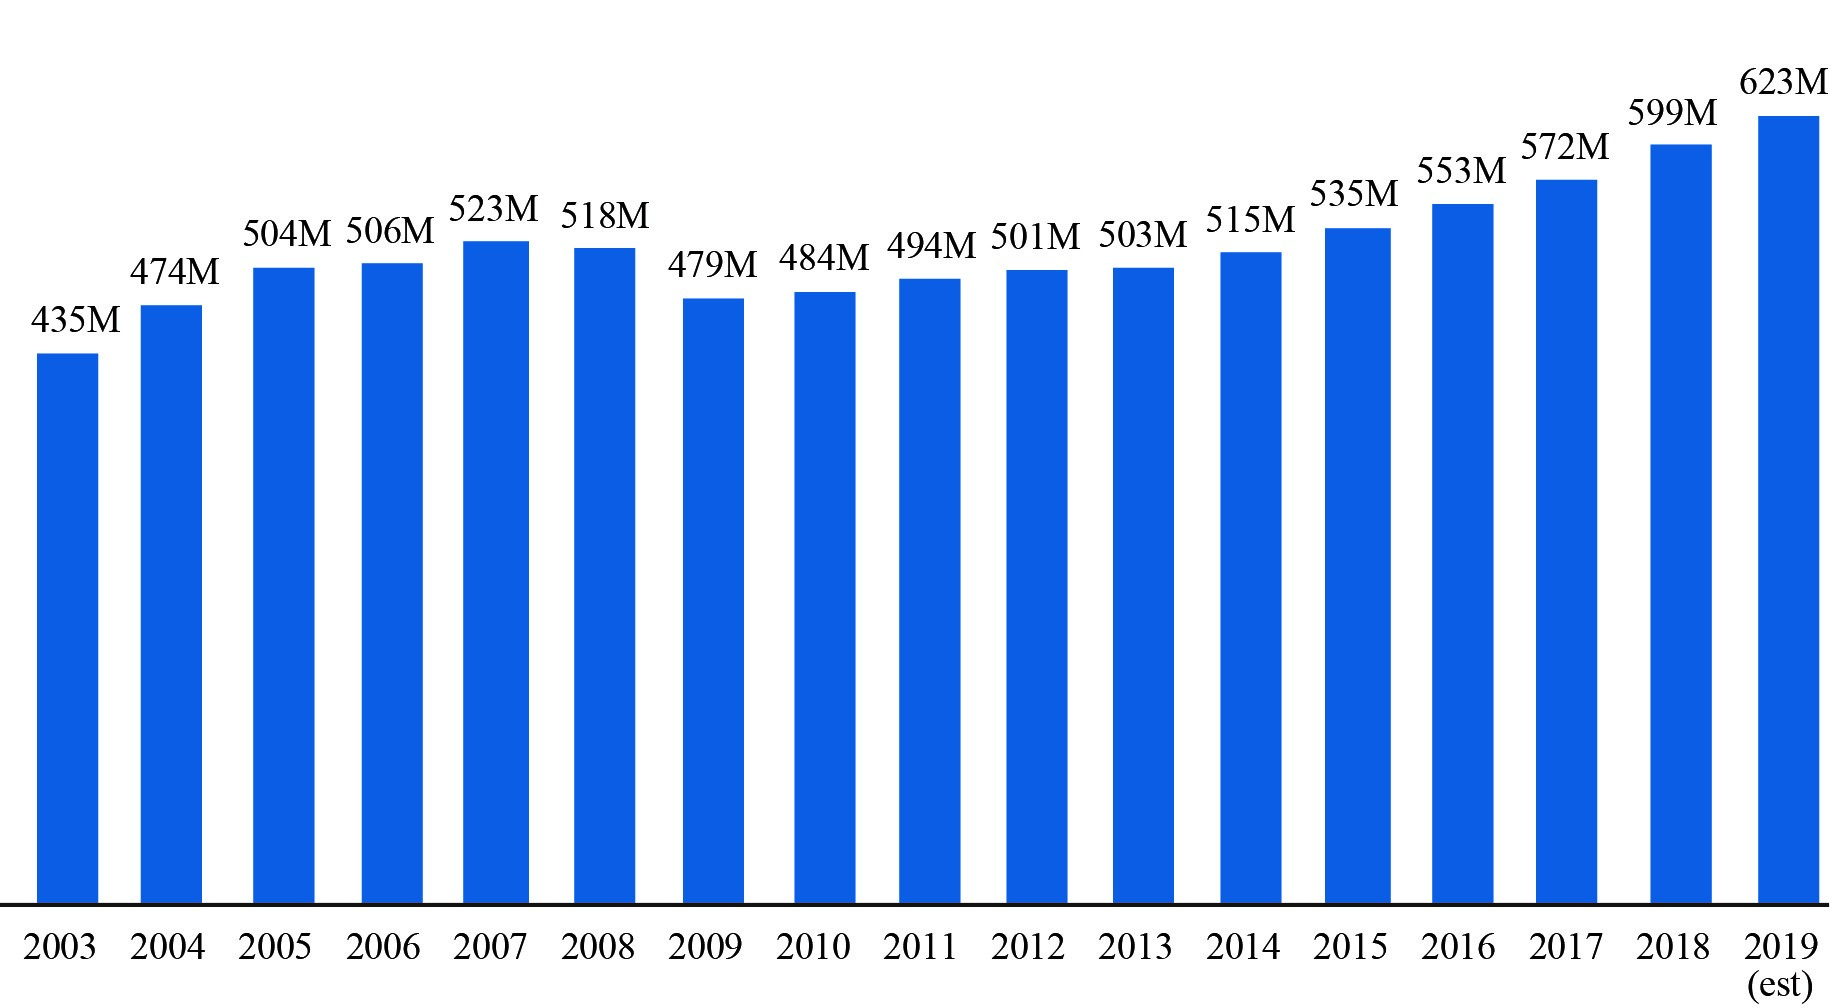
Figure 2. January-August Passengers on U.S. Airlines - 2003-2019
Passengers in millions, unadjusted (000,000)
Figure
Dataset Table:
| U.S. Airline Jan-Aug Passengers | 1 | |
|---|---|---|
| 2003 | 435 | 2 |
| 2004 | 474 | 3 |
| 2005 | 504 | 4 |
| 2006 | 506 | 5 |
| 2007 | 523 | 6 |
| 2008 | 518 | 7 |
| 2009 | 479 | 8 |
| 2010 | 484 | 9 |
| 2011 | 494 | 10 |
| 2012 | 501 | 11 |
| 2013 | 503 | 12 |
| 2014 | 515 | 13 |
| 2015 | 535 | 14 |
| 2016 | 553 | 15 |
| 2017 | 572 | 16 |
| 2018 | 599 | 17 |
| 2019 (est) | 623 | 18 |
| 19 |