
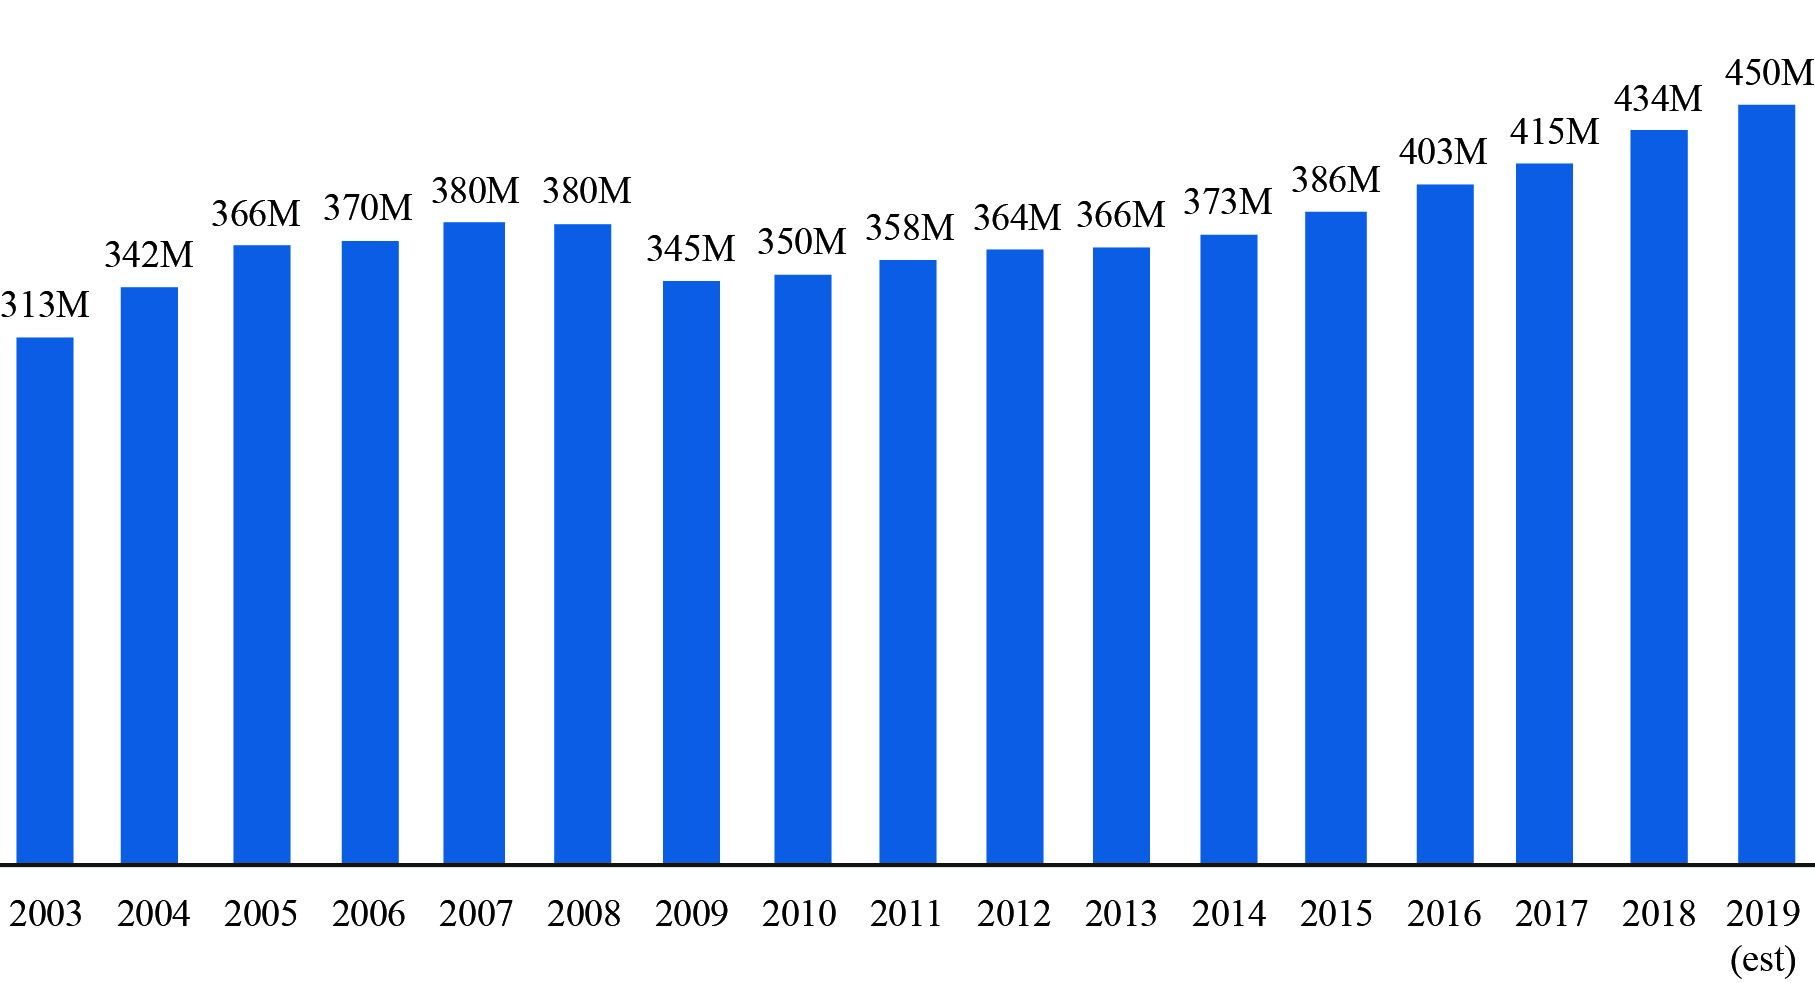
Figure 2. January-June Passengers on U.S. Airlines - 2003-2019
Passengers in millions, unadjusted (000,000)
Figure
Dataset Table:
| U.S. Airline Jan-June Passengers | 1 | |
|---|---|---|
| 2003 | 313 | 2 |
| 2004 | 342 | 3 |
| 2005 | 366 | 4 |
| 2006 | 370 | 5 |
| 2007 | 380 | 6 |
| 2008 | 380 | 7 |
| 2009 | 345 | 8 |
| 2010 | 350 | 9 |
| 2011 | 358 | 10 |
| 2012 | 364 | 11 |
| 2013 | 366 | 12 |
| 2014 | 373 | 13 |
| 2015 | 386 | 14 |
| 2016 | 403 | 15 |
| 2017 | 415 | 16 |
| 2018 | 434 | 17 |
| 2019 (est) | 450 | 18 |
| 19 |