
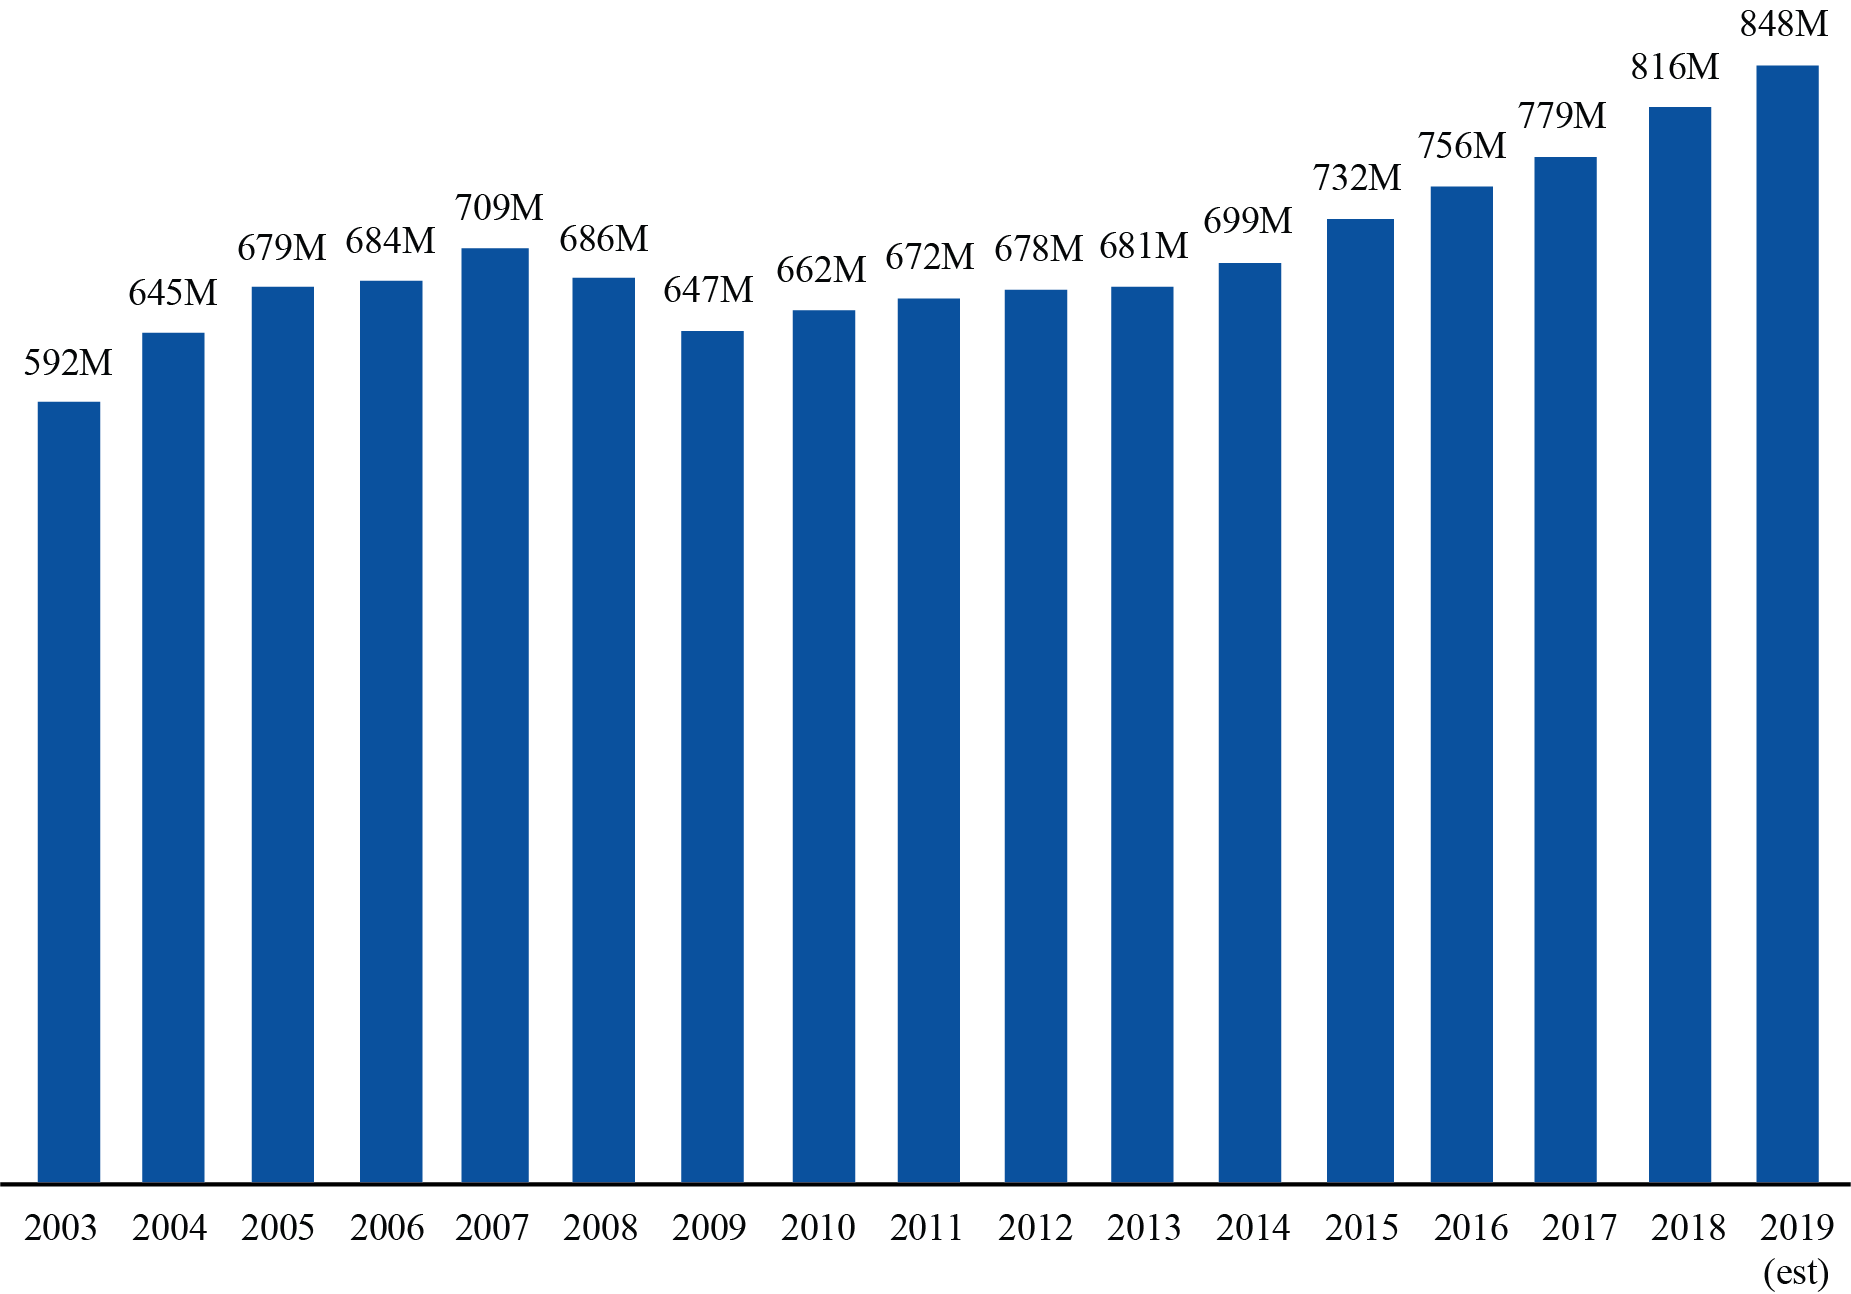
Figure 2. January-November Passengers on U.S. Airlines - 2003-2019
Passengers in millions, unadjusted (000,000)
Figure
Dataset Table:
| U.S. Airline Jan-Nov Passengers | 1 | |
|---|---|---|
| 2003 | 592 | 2 |
| 2004 | 645 | 3 |
| 2005 | 679 | 4 |
| 2006 | 684 | 5 |
| 2007 | 709 | 6 |
| 2008 | 686 | 7 |
| 2009 | 647 | 8 |
| 2010 | 662 | 9 |
| 2011 | 672 | 10 |
| 2012 | 678 | 11 |
| 2013 | 681 | 12 |
| 2014 | 699 | 13 |
| 2015 | 732 | 14 |
| 2016 | 756 | 15 |
| 2017 | 779 | 16 |
| 2018 | 816 | 17 |
| 2019 (est) | 848 | 18 |
| 19 |