
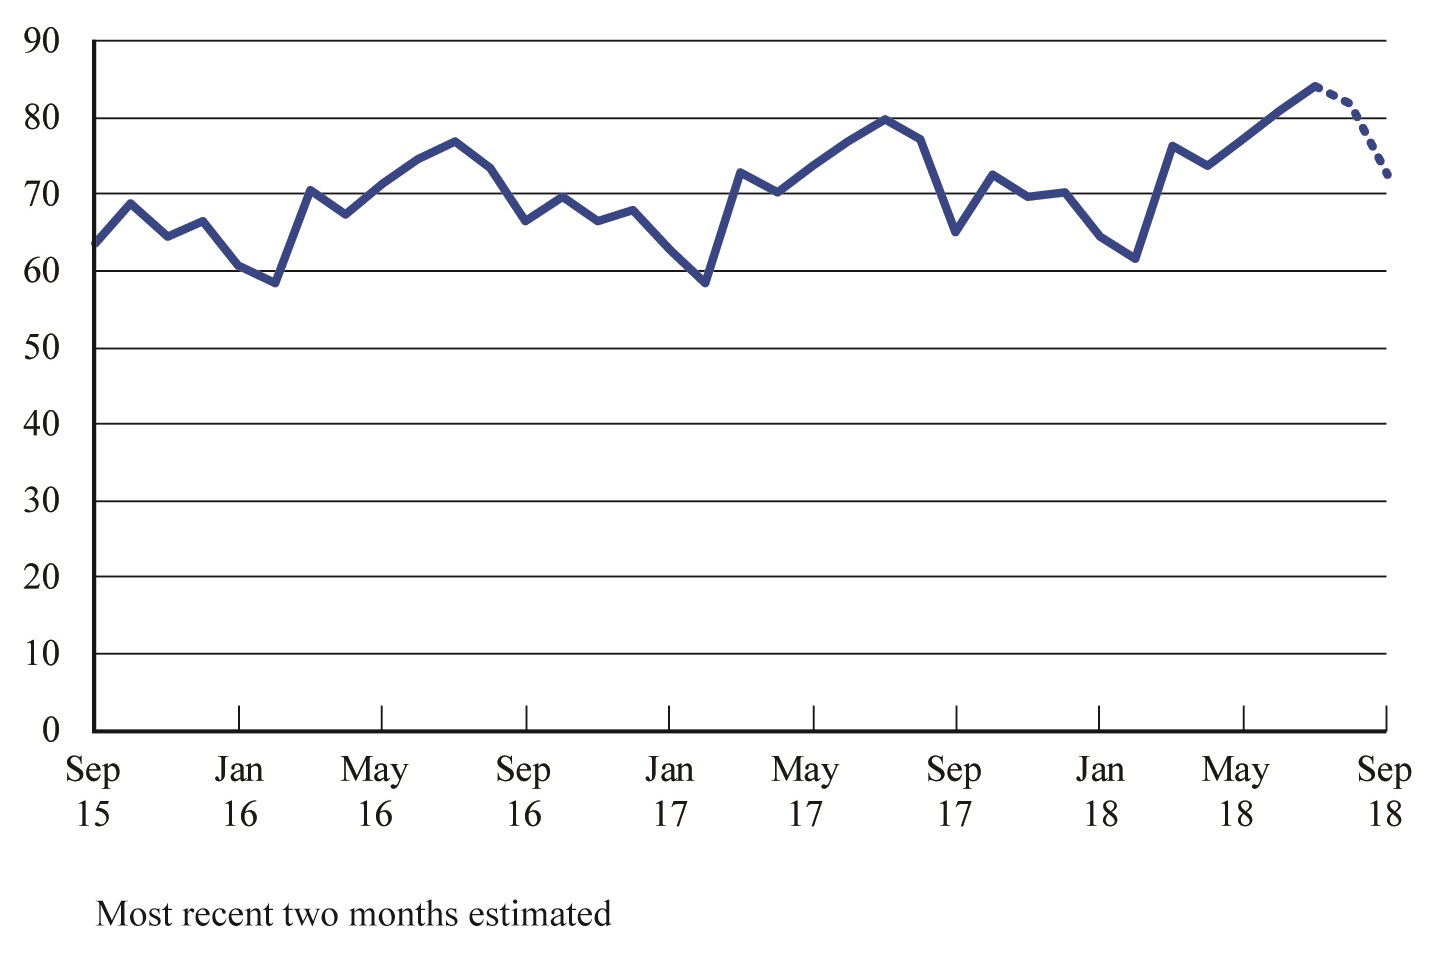
Figure 2. Unadjusted Systemwide Passenger Enplanements on All U.S. Scheduled Airlines (Domestic & International), Sept 2015 - Sept 2018 (Aug-Sept 2018 estimated)
Enplanements in millions (Unadjusted)
Figure
Dataset Table:
| Enplanements in millions (Unadjusted) | 1 | ||||
|---|---|---|---|---|---|
| Sep-15 | 63.7 | 2 | |||
| Oct-15 | 68.7 | 3 | |||
| Nov-15 | 64.6 | 4 | |||
| Dec-15 | 66.4 | 5 |
Notes:
Most recent two months estimated