
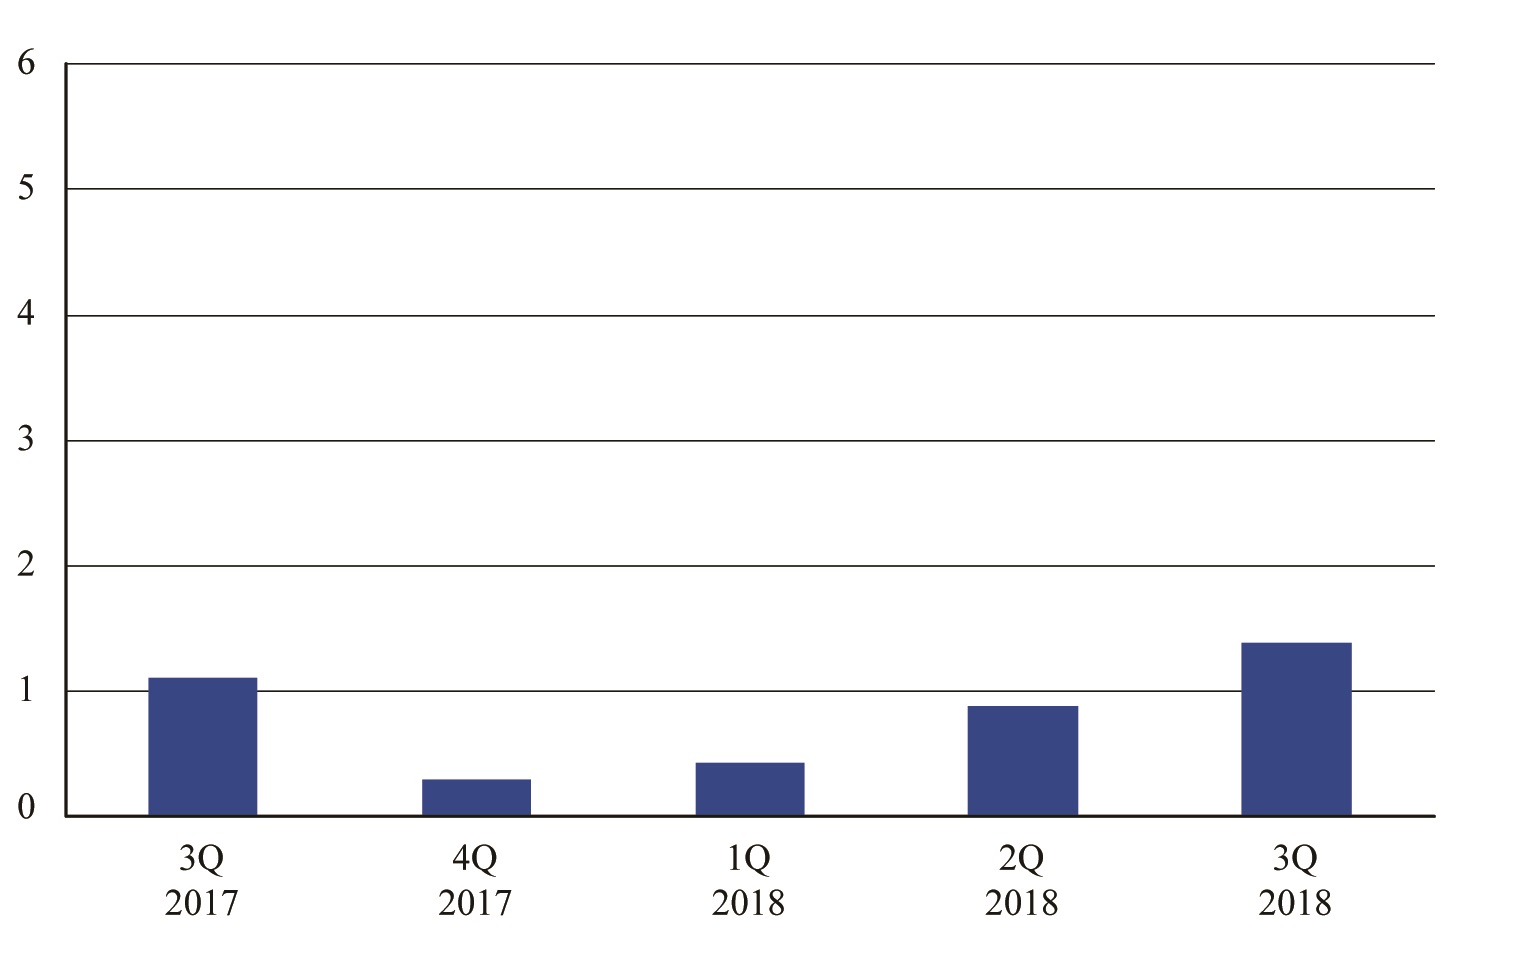
Figure 3. International U.S. Scheduled Service Passenger Airlines Quarterly Net Income
billions of dollars ($)
Figure
Dataset Table:
| billions of dollars ($) | 1 | |
|---|---|---|
| 3Q2017 | 1.1 | 2 |
| 4Q2017 | 0.3 | 3 |
| 1Q2018 | 0.4 | 4 |
| 2Q2018 | 0.9 | 5 |
| 3Q2018 | 1.4 | 6 |
| 7 |
Source:
Source: Bureau of Transportation Statistics, Schedule P1.2 http://www.transtats.bts.gov/Fields.asp?Table_ID=295