
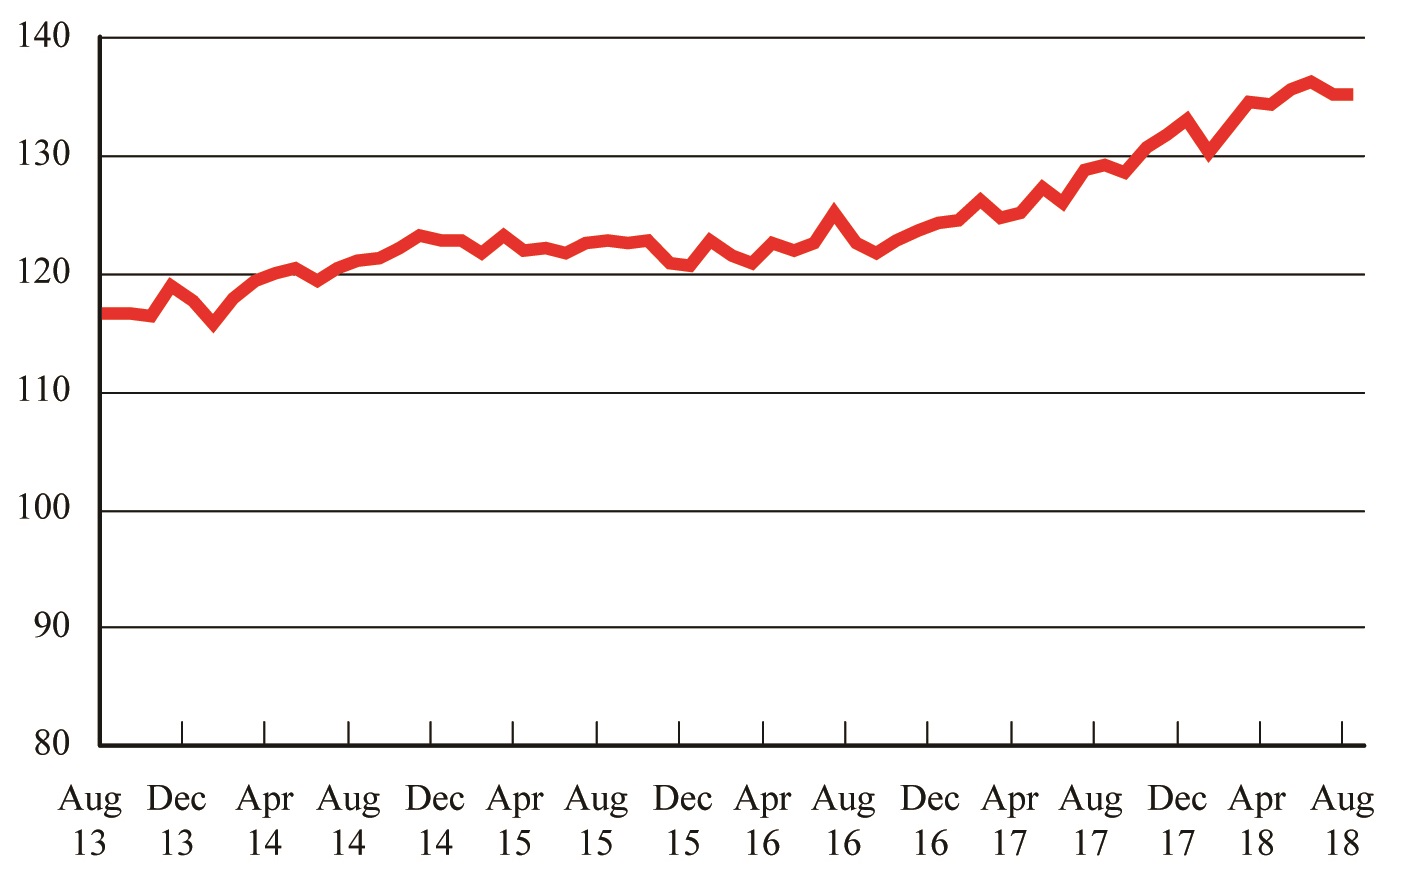
Freight Transportation Services Index, August 2013 - August 2018
(Seasonally Adjusted, Monthly Average of 2000 = 100)
Figure
Dataset Table:
| Month | Freight TSI | 1 | |||
|---|---|---|---|---|---|
| Aug-13 | 116.6 | 2 | |||
| Sep-13 | 116.6 | 3 | |||
| Oct-13 | 116.5 | 4 | |||
| Nov-13 | 119.0 | 5 |
Source:
Bureau of Transportation Statistics