
Freight Flows by Highway, Railway, and Waterway: 2018
Figure
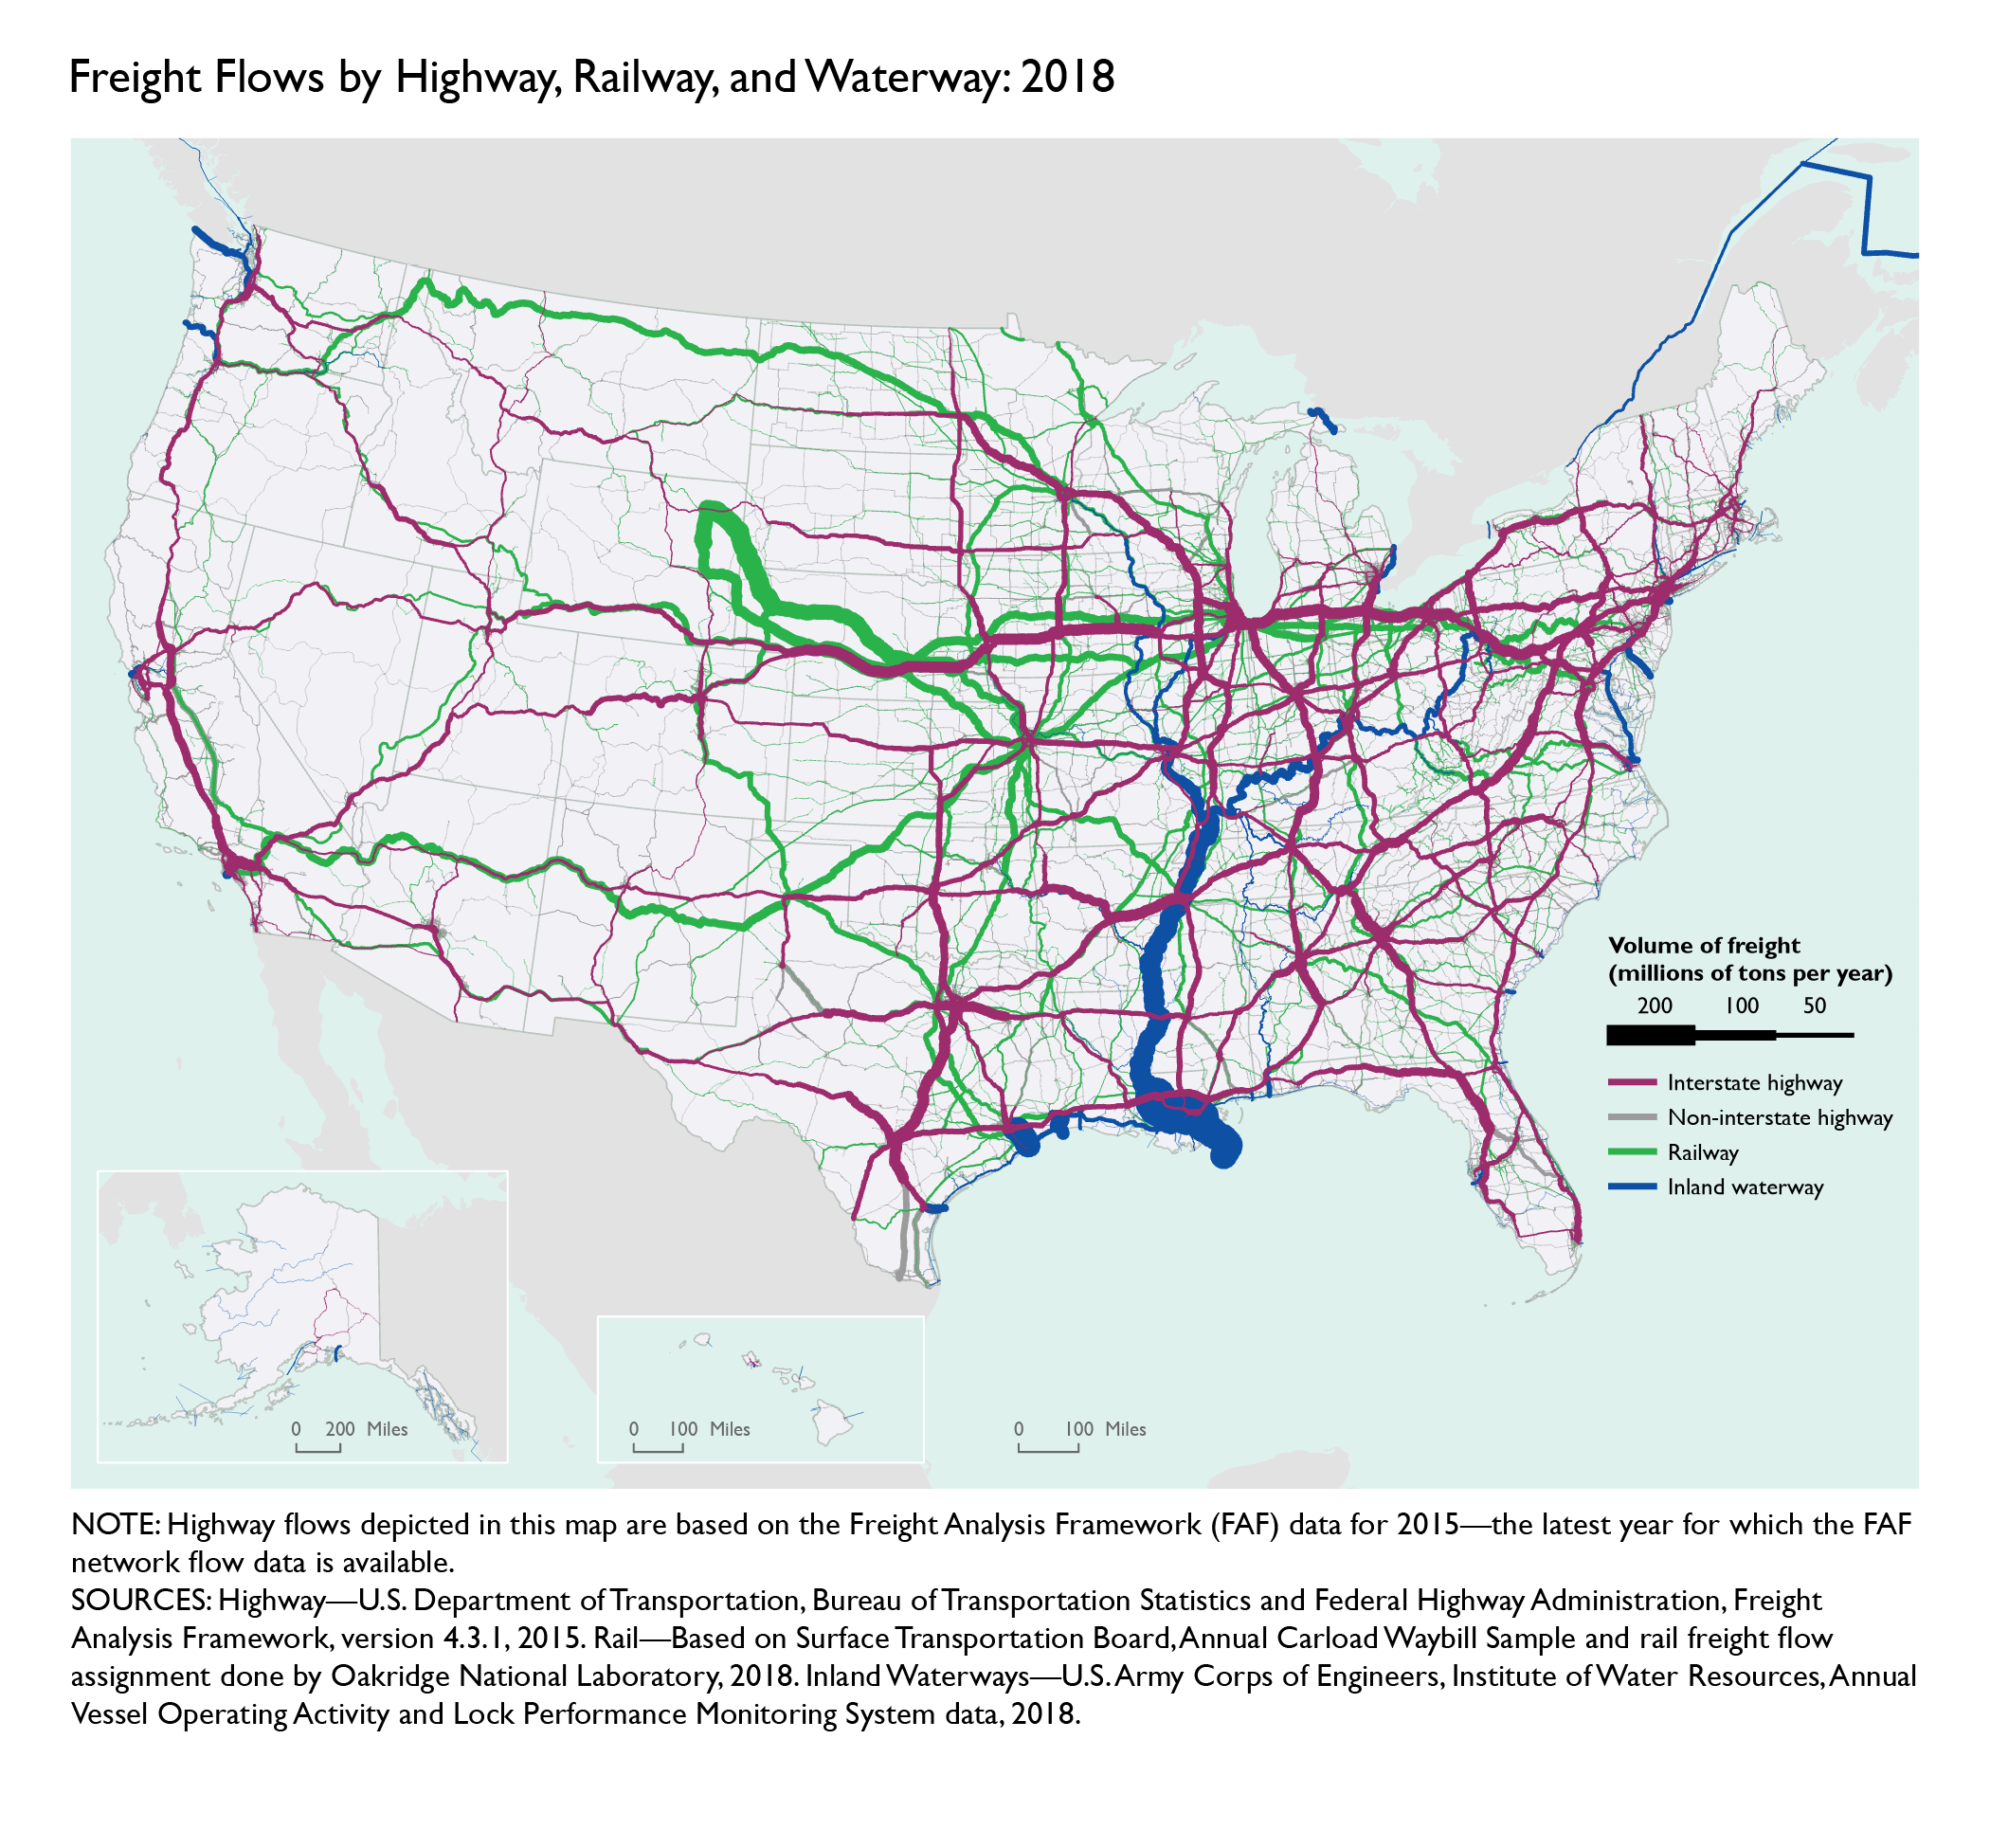
Notes:
Highway flows depicted in this map are based on the Freight Analysis Framework (FAF) data for 2015—the latest year for which the FAF network flow data is available.
Description:
This map is included in the Transportation Statistics Annual Report 2020 publication.
Source:
Highway—U.S. Department of Transportation, Bureau of Transportation Statistics and Federal Highway Administration, Freight Analysis Framework, version 4.3.1, 2015. Rail—Based on Surface Transportation Board, Annual Carload Waybill Sample and rail freight flow assignment done by Oakridge National Laboratory, 2018. Inland Waterways—U.S. Army Corps of Engineers, Institute of Water Resources, Annual Vessel Operating Activity and Lock Performance Monitoring System data, 2018.