
1st-Quarter 2015 Air Fare Data
The average domestic air fare increased to $388 in the first quarter of 2015, up 1.7 percent from $382 in the first quarter of 2014, adjusted for inflation (Table 1), the U.S. Department of Transportation’s Bureau of Transportation Statistics (BTS) reported today.
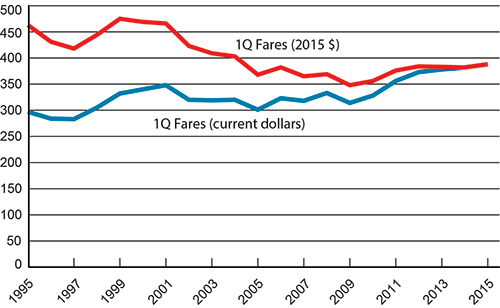
Figure 1. U.S. Average Domestic Fares, 1st Quarter 1995-2015
Source: Bureau of Transportation Statistics, BTS Air Fares, Origin and Destination Survey
BTS reports average fares based on domestic itinerary fares. Itinerary fares consist of round-trip fares, unless the customer does not purchase a return trip. In that case, the one-way fare is included. One-way trips accounted for 34 percent of fares calculated for the first quarter of 2015. Fares are based on the total ticket value, which consists of the price charged by the airlines plus any additional taxes and fees levied by an outside entity at the time of purchase. Fares include only the price paid at the time of the ticket purchase and do not include fees for optional services, such as baggage fees. Averages do not include frequent-flyer or “zero fares,” or abnormally high reported fares. Constant 2015 dollars are used for inflation adjustment.
Note: Frontier Airlines is expected to submit a data revision which may produce changes in fares at Denver and other airports where Frontier operates. Revisions will be posted when received.
Inflation-Adjusted Air Fares
First-quarter fares rose 7.9 percent from the recession-affected low of $348 in 2009 to the first quarter of 2011. Since 2011, first-quarter fares have shown little change, increasing 3.3 percent from 2011 to 2015 (Table 1).
The first-quarter 2015 fare was down 18.2 percent from the average fare of $475 in 1999, the highest inflation-adjusted first quarter average fare in the 20 years since BTS began collecting air fare records in 1995. The 18.2 percent decline took place while overall consumer prices rose 43.1 percent. Since 1995, inflation-adjusted fares declined 16.1 percent compared to a 56.0 percent increase in overall consumer prices (Table 2). See BTS Air Fare web page for historic data.
U.S. passenger airlines collected 74.6 percent of their total revenue from passenger fares during the first quarter of 2015, down from 1995 when 87.6 percent of airline revenue was received from fares (Table 1A).
Quarter-to-Quarter Change
In the three-year period from the first quarter of 2012 to the first quarter of 2015, inflation-adjusted fares increased 1.2 percent. In the two-year period from the first quarter of 2013 to the first quarter of 2015, inflation-adjusted fares increased 1.3 percent (Table 3).
Unadjusted Air Fares
The $388 first-quarter 2015 average fare, up 1.6 percent from the first quarter of 2014, is the highest average fare for any first quarter since 1995. Since 1995, unadjusted fares rose 30.8 percent (Table 4).
First-quarter 2015 fares were down 2.0 percent from the third quarter of 2014, which at $396 was the all-time unadjusted high (Table 5).
Fares by Airport
Figure 2. Fares by Airport Group based on Originating Domestic Passengers 1Q 2015
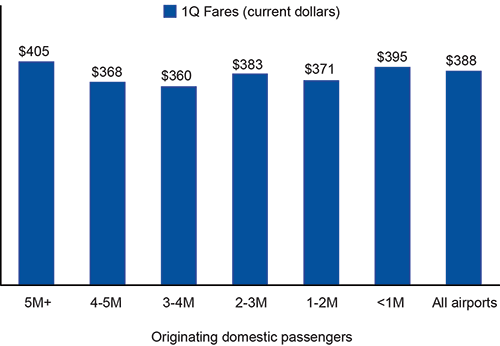
Of airports grouped by the number of originating passengers in the first quarter of 2015, the 12 airports with more than 5 million originating passengers had the highest average fares ($405). Airports with 3 to 4 million originating passengers had the lowest average fares of any group ($360) (Table 6).
Tables listing the airports by group can be found on the BTS Air Fare web page.
For additional data, see Top 100 Airports or All Airports. Since average fares are based on the Origin and Destination Survey 10 percent ticket sample, averages for airports with smaller samples may be less reliable. Fares for Alaska, Hawaii and Puerto Rico airports are not included in rankings but are available on the web page. Second-quarter 2015 average fare data will be released Oct. 27.
Table 1. 1st Quarter Average Fare 1995-2015, Adjusted for Inflation
| Year | Average Fare in constant 2015 dollars ($) | Year-to-Year Percent Change in Average Fare (1Q to 1Q) (%) | Cumulative Percent Change in Average Fare (1Q 1995 to 1Q of each year) (%) |
|---|---|---|---|
| 1995 | 463 | ||
| 1996 | 431 | -7.0 | -7.0 |
| 1997 | 418 | -2.9 | -9.7 |
| 1998 | 444 | 6.1 | -4.2 |
| 1999 | 475 | 7.0 | 2.5 |
| 2000 | 469 | -1.2 | 1.3 |
| 2001 | 466 | -0.7 | 0.6 |
| 2002 | 423 | -9.3 | -8.7 |
| 2003 | 409 | -3.2 | -11.6 |
| 2004 | 403 | -1.4 | -12.9 |
| 2005 | 368 | -8.8 | -20.5 |
| 2006 | 382 | 3.8 | -17.5 |
| 2007 | 365 | -4.4 | -21.1 |
| 2008 | 369 | 0.8 | -20.4 |
| 2009 | 348 | -5.5 | -24.8 |
| 2010 | 356 | 2.2 | -23.1 |
| 2011 | 376 | 5.6 | -18.8 |
| 2012 | 384 | 2.1 | -17.1 |
| 2013 | 383 | -0.1 | -17.2 |
| 2014 | 382 | -0.4 | -17.5 |
| 2015 | 388 | 1.7 | -16.1 |
Source: Bureau of Transportation Statistics, BTS Air Fares and Origin and Destination Survey
Note: Percent change based on unrounded numbers
Table 1A. Passenger Airline Revenue from Fares 1990-2015
| Year | Revenue from Passenger Fares as Percent of Total Scheduled Passenger Airline Operating Revenue* (%) |
|---|---|
| 1990 | 88.5 |
| 1995 | 87.6 |
| 2000 | 88.9 |
| 2001 | 87.8 |
| 2002 | 87.1 |
| 2003 | 84.9 |
| 2004 | 80.6 |
| 2005 | 78.4 |
| 2006 | 77.6 |
| 2007 | 77.7 |
| 2008 | 75.9 |
| 2009 | 73.7 |
| 2010 | 74.8 |
| 2011 | 74.6 |
| 2012 | 74.1 |
| 2013 | 74.6 |
| 2014 | 74.8 |
| 2015 (1Q) | 74.6 |
Source: Bureau of Transportation Statistics, P-12
* From Schedule P-12: Passenger Revenue (Fares) (Acct 3901) as a percentage of Total Operating Revenues (4999).
Table 2. Percent Changes to 2015 in Average Domestic Average Fares and the Inflation Rate* by Year Since 1995
(1st Quarter to 1st Quarter for fares; March to March for inflation)
| Since 1st Quarter of ... | Duration in Years | Average Fare in constant 2015 dollars ($) | Percent Change in Average Fare to 1stQuarter 2015 (%) | Inflation Rate Change to March 2015 |
|---|---|---|---|---|
| 2015 | 388 | |||
| 2014 | 1 | 382 | 1.7 | -0.1 |
| 2013 | 2 | 383 | 1.3 | 1.4 |
| 2012 | 3 | 384 | 1.2 | 2.9 |
| 2011 | 4 | 376 | 3.3 | 5.7 |
| 2010 | 5 | 356 | 9.1 | 8.5 |
| 2009 | 6 | 348 | 11.5 | 11.0 |
| 2008 | 7 | 369 | 5.4 | 10.6 |
| 2007 | 8 | 365 | 6.3 | 15.0 |
| 2006 | 9 | 382 | 1.6 | 18.2 |
| 2005 | 10 | 368 | 5.5 | 22.2 |
| 2004 | 11 | 403 | -3.8 | 26.0 |
| 2003 | 12 | 409 | -5.1 | 28.2 |
| 2002 | 13 | 423 | -8.1 | 32.1 |
| 2001 | 14 | 466 | -16.7 | 34.0 |
| 2000 | 15 | 469 | -17.2 | 37.9 |
| 1999 | 16 | 475 | -18.2 | 43.1 |
| 1998 | 17 | 444 | -12.5 | 45.6 |
| 1997 | 18 | 418 | -7.2 | 47.6 |
| 1996 | 19 | 431 | -9.8 | 51.6 |
| 1995 | 20 | 463 | -16.1 | 56.0 |
Source: Bureau of Transportation Statistics, BTS Air Fares and Origin and Destination Survey
* Rate calculated using Bureau of Labor Statistics Consumer Price Index
Table 3. Inflation-Adjusted Average Domestic Airline Fares by Quarter
Average Fare and Percent Change by Quarter
| Quarter/Year | Average Domestic Fare (2015$) | |
|---|---|---|
| Average Fare in constant 2015 dollars ($) | Quarter-to-Quarter Percent Change in Average Fare (%) | |
| 2Q 2011 | 387 | 2.9 |
| 3Q 2011 | 375 | -2.9 |
| 4Q 2011 | 385 | 2.7 |
| 1Q 2012 | 384 | -0.4 |
| 2Q 2012 | 396 | 3.1 |
| 3Q 2012 | 374 | -5.4 |
| 4Q 2012 | 385 | 2.8 |
| 1Q 2013 | 383 | -0.4 |
| 2Q 2013 | 382 | -0.3 |
| 3Q 2013 | 393 | 2.9 |
| 4Q 2013 | 387 | -1.6 |
| 1Q 2014 | 382 | -1.3 |
| 2Q 2014* | 396 | 3.6 |
| 3Q 2014* | 396 | 0.2 |
| 4Q 2014* | 393 | -0.9 |
| 1Q 2015* | 388 | -1.1 |
Source: Bureau of Transportation Statistics, BTS Air Fares and Origin and Destination Survey
Note: Percent change based on unrounded numbers
* Fares for the most recent four quarters are in current dollars, not adjusted for inflation.
Table 4. Unadjusted 1st Quarter Average Fares, 1995-2015
| Year | Average Fare in current dollars ($) | Year-to-Year Percent Change in Average Fare (1Q to 1Q) (%) | Cumulative Percent Change in Average Fare (1Q 1995 to 1Q of each year) (%) |
|---|---|---|---|
| 1995 | 297 | ||
| 1996 | 284 | -4.4 | -4.4 |
| 1997 | 283 | -0.2 | -4.5 |
| 1998 | 305 | 7.5 | 2.6 |
| 1999 | 332 | 8.9 | 11.7 |
| 2000 | 340 | 2.6 | 14.6 |
| 2001 | 348 | 2.2 | 17.1 |
| 2002 | 320 | -8.0 | 7.8 |
| 2003 | 319 | -0.3 | 7.5 |
| 2004 | 320 | 0.3 | 7.9 |
| 2005 | 301 | -5.9 | 1.5 |
| 2006 | 323 | 7.3 | 8.9 |
| 2007 | 318 | -1.7 | 7.1 |
| 2008 | 333 | 4.9 | 12.3 |
| 2009 | 314 | -5.8 | 5.7 |
| 2010 | 328 | 4.6 | 10.5 |
| 2011 | 356 | 8.4 | 19.8 |
| 2012 | 373 | 4.8 | 25.6 |
| 2013 | 378 | 1.4 | 27.3 |
| 2014 | 382 | 1.1 | 28.7 |
| 2015 | 388 | 1.6 | 30.8 |
Source: Bureau of Transportation Statistics, BTS Air Fares and Origin and Destination Survey
Note: Percent change based on unrounded numbers
Table 5. Unadjusted Average Domestic Airline Fares by Quarter
Average Fare and Percent Change by Quarter
| Quarter/Year | Average Domestic Fare (current$) | |
|---|---|---|
| Average Fare in current dollars ($) | Quarter-to-Quarter Percent Change in Average Fare (%) | |
| 2Q 2011 | 370 | 3.9 |
| 3Q 2011 | 361 | -2.4 |
| 4Q 2011 | 368 | 2.1 |
| 1Q 2012 | 373 | 1.2 |
| 2Q 2012 | 385 | 3.2 |
| 3Q 2012 | 367 | -4.6 |
| 4Q 2012 | 374 | 2.0 |
| 1Q 2013 | 378 | 1.0 |
| 2Q 2013 | 378 | 0.0 |
| 3Q 2013 | 390 | 3.2 |
| 4Q 2013 | 382 | -2.0 |
| 1Q 2014 | 382 | 0.0 |
| 2Q 2014 | 396 | 3.5 |
| 3Q 2014 | 396 | 0.2 |
| 4Q 2014 | 393 | -0.9 |
| 1Q 2015 | 388 | -1.1 |
Source: Bureau of Transportation Statistics, BTS Air Fares and Origin and Destination Survey
Note: Percent change based on unrounded numbers
Table 6. Fares at Airports Grouped by Originating Passengers
Based on 1Q2015 U.S. Originating Domestic Passengers
| Airport Groups based on 1Q 2015 Originating Passengers | Average Fare 1st Quarter 2015 ($) | Percent of Total Passengers |
|---|---|---|
| 5 million+ | 405 | 36 |
| 4-5 million | 368 | 12 |
| 3-4 million | 360 | 12 |
| 2-3 million | 383 | 16 |
| 1-2 million | 371 | 13 |
| less than 1 million | 395 | 11 |
| Average Fare at All Airports | 388 | 100 |
Source: Bureau of Transportation Statistics, BTS Air Fares and Origin and Destination Survey