
2012 Surface Trade with Canada and Mexico Rose 6.2 Percent from 2011
Figure 1: Surface Trade between U.S. and NAFTA: 1995 – 2012
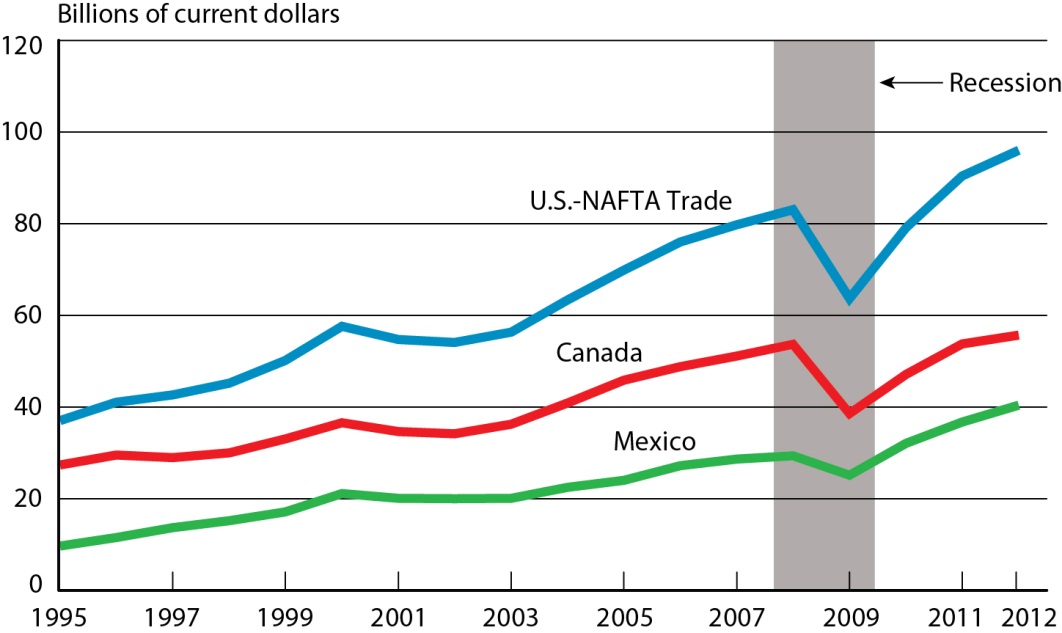
SOURCE: U.S. Department of Transportation, Research and Innovative Technology Administration, Bureau of Transportation Statistics, based on Transborder Freight Data, available at https://data.bts.gov/stories/s/TransBorder-Freight-Data/myhq-rm6q/, as of February 28, 2013.
NOTES: Numbers might not add to totals due to rounding.
Trade using surface transportation modes between the United States and its North American Free Trade Agreement (NAFTA) partners Canada and Mexico increased by 6.2 percent in 2012 compared to 2011, valued at $960 billion in 2012, according to the Bureau of Transportation Statistics (BTS) of the U.S. Department of Transportation. The $960 billion in U.S.-NAFTA surface mode trade was the highest annual amount since NAFTA went into effect in 1994 (Table 1).
BTS, a part of the Department’s Research and Innovative Technology Administration (RITA), reported that U.S. imports by surface mode increased 5.6 percent in 2012 from 2011, while surface-based exports increased 6.9 percent during the same period (Table 2).
During the recession period of December 2007 to June 2009, U.S. trade carried by surface modes to and from Mexico declined less than trade with Canada and also rebounded faster. The value of U.S.-Mexico surface trade declined 14.4 percent in 2009 from 2008, and then increased by 61.0 percent in the next three years to reach a level in 2012 that was 37.8 percent higher than in 2008. The value of U.S.-Canada surface trade declined 28.1 percent in 2009 from 2008, and then increased by 44.2 percent in the next three years to reach a level in 2012 that was only 3.6 higher than in 2008. As a result, U.S.-Mexico trade comprised 42.1 percent of North American surface freight trade in 2012, compared to 35.3 percent in 2008.
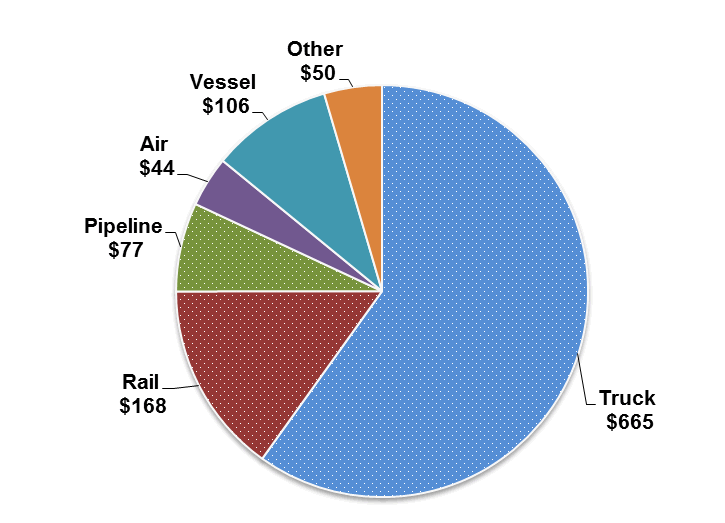
Figure 2: North American Surface Freight by Mode, 2012
| Mode | Total Trade Value |
| All Modes | 1,109,987,545,709 |
| All Surface Modes | 960,134,550,217 |
| Truck | 664,739,193,480 |
| Rail | 167,504,167,676 |
| Pipeline | 77,438,979,411 |
| Air | 43,999,088,005 |
| Vessel | 105,853,907,487 |
| Other and Unknown Modes | 50,452,209,650 |
Surface modes shown by dotted segments
(billions of current dollars)
SOURCE: Bureau of Transportation Statistics, Transborder Freight Data, https://data.bts.gov/stories/s/TransBorder-Freight-Data/myhq-rm6q/
In 2012, 86.5 percent of U.S. merchandise trade by value with Canada and Mexico entered or exited the country by surface mode of transportation (Figure 2). Total North American surface transportation trade is up by 50.8 percent since 2009, when U.S.-NAFTA trade fell to a recent low during the recession (Table 3). In 2009, U.S.-NAFTA trade decreased by 23.3 percent from the previous year (Table 1). See North American Transborder Freight Data for historic data.
U.S. Surface Transportation Trade with Canada
U.S.-Canada surface transportation trade totaled $556.2 billion in 2012, an increase of 3.6 percent compared to 2011 (Table 4). The value of goods transported by rail had the largest year-to-year increase. Imports carried by rail were 7.4 percent higher in 2012 than 2011 while the value of exports carried by rail was 11.8 percent higher. The value of pipeline imports and exports decreased, dropping 4.3 and 2.3 percent respectively in 2012 compared to 2011.
Michigan led all states in surface trade with Canada in 2012 with $73.3 billion (Table 5). Vehicles and vehicle parts accounted for $45.2 billion, 61.7 percent of total Michigan-Canada surface trade. Of the top 10 states for U.S.-Canada surface trade in 2012, California had the highest percentage change over 2011, a 16.5 percent increase. The increase in California-Canada surface trade was led by a 41.5 percent increase in vehicles and vehicle parts, the largest commodity by value in California-Canada surface trade.
The top commodity category overall transported between the U.S. and Canada by surface modes of transportation in 2012 was vehicles and vehicle parts (other than railway vehicles and parts) with $107.4 billion in trade (Table 8). U.S.-Canada trade of this commodity group was split roughly even between exports and imports, reflecting the interdependency of automotive plants on both sides of the border.
U.S. Surface Transportation Trade with Mexico
U.S.-Mexico surface transportation trade totaled $403.9 billion in 2012, an increase of 10.0 percent compared to 2011 (Table 6). Similar to the trend on the northern border, the value of goods transported by rail had the highest year to your increase. Imports carried by rail were 14.3 percent higher in 2012 than 2011, while the value of exports carried by rail was 11.1 percent higher. However, the value of U.S.-Mexico pipeline trade was down in 2012 compared to 2011, imports decreased by 23.8 percent and exports decreased by 2.1 percent.
Texas led all states in surface trade with Mexico in 2012 with $145.8 billion (Table 7). This is the fourth time on record that Texas has had more than $100 billion in trade with Mexico by surface modes of transportation in a calendar year. Five commodities more than doubled in the value of Texas-Mexico trade in 2012 over 2011; the most notable was pearls and precious stones which increased by more than $2 billion from the previous year. Five of the top 10 states with U.S.-Mexico surface trade in 2012 saw double digit percent increases from 2011.
The top commodity transported between the U.S. and Mexico by surface modes of transportation was electrical machinery with $85.7 billion moved in 2012 (Table 9). Measuring and testing equipment was the fifth highest commodity by value on the U.S.-Mexico Border, compared with its ranking as the 12th highest on the U.S.-Canada Border.
TransBorder Data
The TransBorder Freight Dataset is a special extract of the official U.S. foreign trade statistics. The data are obtained by BTS from the U.S. Census Bureau’s Foreign Trade Division. TransBorder numbers include data received by BTS as of Feb. 8.
This news release and summary tables can be found at http://www.bts.dot.gov/. More information on Transborder freight data is posted on the BTS website at https://data.bts.gov/stories/s/TransBorder-Freight-Data/myhq-rm6q/.
Table 1. Annual Value of U.S. Surface Transportation Trade with Canada and Mexico and Percent Change from Previous Year
(millions of current dollars)
| Year | Amount | Percent Change from Previous Year |
|---|---|---|
| 1995 | 370,265 | NA |
| 1996 | 410,382 | 10.8 |
| 1997 | 425,977 | 3.8 |
| 1998 | 451,736 | 6.0 |
| 1999 | 501,250 | 11.0 |
| 2000 | 575,713 | 14.9 |
| 2001 | 547,312 | -4.9 |
| 2002 | 540,795 | -1.2 |
| 2003 | 562,776 | 4.1 |
| 2004 | 633,563 | 12.6 |
| 2005 | 697,987 | 10.2 |
| 2006 | 760,127 | 8.9 |
| 2007 | 797,303 | 4.9 |
| 2008 | 829,875 | 4.1 |
| 2009 | 636,695 | -23.3 |
| 2010 | 791,329 | 24.3 |
| 2011 | 904,133 | 14.3 |
| 2012 | 960,135 | 6.2 |
SOURCE: Bureau of Transportation Statistics, Transborder Freight Data, https://data.bts.gov/stories/s/TransBorder-Freight-Data/myhq-rm6q/
NOTES: Numbers may not add to totals due
Table 2. U.S. Merchandise Trade with Canada and Mexico by Surface Modes of Transportation
(millions of current dollars)
| Mode | 2010 | 2011 | 2012 | Percent Change 2010 - 2011 | Percent Change 2011 - 2012 | |
|---|---|---|---|---|---|---|
| All Surface Modes | Imports | 427,592 | 486,662 | 513,694 | 13.8 | 5.6 |
| Exports | 363,738 | 417,471 | 446,440 | 14.8 | 6.9 | |
| Total | 791,329 | 904,133 | 960,135 | 14.3 | 6.2 | |
| Truck | Imports | 272,186 | 303,012 | 321,351 | 11.3 | 6.1 |
| Exports | 284,698 | 322,846 | 343,388 | 13.4 | 6.4 | |
| Rail | Imports | 85,480 | 97,422 | 106,825 | 14.0 | 9.7 |
| Exports | 45,748 | 54,431 | 60,679 | 19.0 | 11.5 | |
| Pipeline | Imports | 57,744 | 71,024 | 67,947 | 23.0 | -4.3 |
| Exports | 5,189 | 9,703 | 9,492 | 87.0 | -2.2 |
SOURCE: Bureau of Transportation Statistics, Transborder Freight Data, https://data.bts.gov/stories/s/TransBorder-Freight-Data/myhq-rm6q/
NOTE: Percent change based on numbers prior to rounding. Numbers may not add to totals due to rounding.
NOTE: The value of trade for all surface modes is not equal to the sum of truck, rail and pipeline modes. It also includes shipments made by mail, foreign trade zones, other and unknown modes of transportation. For additional detail refer to the Transborder web page: https://data.bts.gov/stories/s/TransBorder-Freight-Data/myhq-rm6q/
Table 3. Prior Year Surface Trade with Canada and Mexico Compared with 2012
| 2012 Compared to | Percent Change to 2012 | ||
|---|---|---|---|
| Imports | Exports | Total Surface Trade | |
| 2011 | 5.6 | 6.9 | 6.2 |
| 2010 | 20.1 | 22.7 | 21.3 |
| 2009 | 50.4 | 51.3 | 50.8 |
| 2008 | 10.6 | 22.2 | 15.7 |
| 2007 | 13.5 | 29.5 | 20.4 |
| 2006 | 18.3 | 36.9 | 26.3 |
| 2005 | 28.2 | 50.2 | 37.6 |
| 2004 | 41.0 | 65.9 | 51.5 |
| 2003 | 59.4 | 85.6 | 70.6 |
| 2002 | 66.1 | 92.8 | 77.5 |
SOURCE: Bureau of Transportation Statistics, Transborder Freight Data, https://data.bts.gov/stories/s/TransBorder-Freight-Data/myhq-rm6q/
Table 4. U.S. Merchandise Trade with Canada by Surface Modes of Transportation
(millions of current dollars)
| Mode | 2010 | 2011 | 2012 | Percent Change 2010 - 2011 | Percent Change 2011 - 2012 | |
|---|---|---|---|---|---|---|
| All Surface Modes | Imports | 246,252 | 282,582 | 290,096 | 14.8 | 2.7 |
| Exports | 224,809 | 254,450 | 266,120 | 13.2 | 4.6 | |
| Total | 471,061 | 537,031 | 556,216 | 14.0 | 3.6 | |
| Truck | Imports | 123,238 | 135,528 | 138,948 | 10.0 | 2.5 |
| Exports | 173,588 | 195,126 | 202,542 | 12.4 | 3.8 | |
| Rail | Imports | 56,996 | 65,118 | 69,914 | 14.3 | 7.4 |
| Exports | 26,116 | 29,569 | 33,068 | 13.2 | 11.8 | |
| Pipeline | Imports | 57,562 | 70,743 | 67,733 | 22.9 | -4.3 |
| Exports | 3,151 | 6,211 | 6,071 | 97.1 | -2.3 |
SOURCE: Bureau of Transportation Statistics, Transborder Freight Data, https://data.bts.gov/stories/s/TransBorder-Freight-Data/myhq-rm6q/
NOTE: Percent change based on numbers prior to rounding. Numbers may not add to totals due to rounding.
NOTE: The value of trade for all surface modes is not equal to the sum of truck, rail and pipeline modes. It also includes shipments made by mail, foreign trade zones, other and unknown modes of transportation. For additional detail refer to the Transborder web page: https://data.bts.gov/stories/s/TransBorder-Freight-Data/myhq-rm6q/
Table 5. Top 10 States Trading with Canada by Surface Modes of Transportation
Ranked by 2012 Value
(millions of current dollars)
| State | 2011 | 2012 | Percent Change 2011 -2012 | ||
|---|---|---|---|---|---|
| Value | Rank | Value | Rank | ||
| Michigan | 68,412 | 1 | 73,258 | 1 | 7.1 |
| Illinois | 53,845 | 2 | 57,326 | 2 | 6.5 |
| California | 31,331 | 4 | 36,506 | 3 | 16.5 |
| Ohio | 33,123 | 3 | 34,121 | 4 | 3.0 |
| Texas | 30,608 | 5 | 32,370 | 5 | 5.8 |
| New York | 30,076 | 6 | 27,950 | 6 | -7.1 |
| Pennsylvania | 21,097 | 7 | 20,844 | 7 | -1.2 |
| Washington | 20,250 | 8 | 19,548 | 8 | -3.5 |
| Indiana | 17,714 | 10 | 18,951 | 9 | 7.0 |
| Minnesota | 18,193 | 9 | 18,513 | 10 | 1.8 |
SOURCE: Bureau of Transportation Statistics, Transborder Freight Data, https://data.bts.gov/stories/s/TransBorder-Freight-Data/myhq-rm6q/
NOTE: Percent change based on numbers prior to rounding.
Table 6. U.S. Merchandise Trade with Mexico by Surface Modes of Transportation
(millions of current dollars)
| Mode | 2010 | 2011 | 2012 | Percent Change 2010 - 2011 | Percent Change 2011 - 2012 | |
|---|---|---|---|---|---|---|
| All Surface Modes | Imports | 181,339 | 204,080 | 223,599 | 12.5 | 9.6 |
| Exports | 138,929 | 163,021 | 180,320 | 17.3 | 10.6 | |
| Total | 320,268 | 367,101 | 403,919 | 14.6 | 10.0 | |
| Truck | Imports | 148,948 | 167,483 | 182,403 | 12.4 | 8.9 |
| Exports | 111,110 | 127,720 | 140,846 | 15.0 | 10.3 | |
| Rail | Imports | 28,484 | 32,303 | 36,912 | 13.4 | 14.3 |
| Exports | 19,632 | 24,862 | 27,611 | 26.6 | 11.1 | |
| Pipeline | Imports | 182 | 281 | 214 | 54.9 | -23.8 |
| Exports | 2,038 | 3,492 | 3,421 | 71.3 | -2.1 |
SOURCE: Bureau of Transportation Statistics, Transborder Freight Data, https://data.bts.gov/stories/s/TransBorder-Freight-Data/myhq-rm6q/
NOTE: Percent change based on numbers prior to rounding. Numbers may not add to totals due to rounding.
NOTE: The value of trade for all surface modes is not equal to the sum of truck, rail and pipeline modes. It also includes shipments made by mail, foreign trade zones, other and unknown modes of transportation. For additional detail refer to the Transborder web page: https://data.bts.gov/stories/s/TransBorder-Freight-Data/myhq-rm6q/
Table 7. Top 10 States Trading with Mexico by Surface Modes of Transportation
Ranked by 2012 Value
(millions of current dollars)
| State | 2011 | 2012 | Percent Change 2011 - 2012 | ||
|---|---|---|---|---|---|
| Value | Rank | Value | Rank | ||
| Texas | 128,981 | 1 | 145,850 | 1 | 13.1 |
| California | 54,496 | 2 | 56,994 | 2 | 4.6 |
| Michigan | 41,376 | 3 | 48,110 | 3 | 16.3 |
| Illinois | 12,588 | 4 | 13,666 | 4 | 8.6 |
| Arizona | 11,725 | 5 | 12,848 | 5 | 9.6 |
| Ohio | 9,687 | 6 | 10,739 | 6 | 10.9 |
| Tennessee | 7,326 | 7 | 8,741 | 7 | 19.3 |
| Indiana | 6,633 | 8 | 7,250 | 8 | 9.3 |
| North Carolina | 6,009 | 9 | 6,727 | 9 | 12.0 |
| Georgia | 5,265 | 10 | 5,406 | 10 | 2.7 |
SOURCE: Bureau of Transportation Statistics, Transborder Freight Data, https://data.bts.gov/stories/s/TransBorder-Freight-Data/myhq-rm6q/
NOTE: Percent change based on numbers prior to rounding.
Table 8. Top Five Commodities Transported between the U.S. and Canada by Surface Modes of Transportation, 2012
(millions of current dollars)
| Commodities | Exports | Imports | Total |
|---|---|---|---|
| Vehicles Other than Railway | 49,853 | 57,548 | 107,401 |
| Mineral Fuels; Oils and Waxes | 12,762 | 83,499 | 96,261 |
| Computer-Related Machinery and Parts | 44,437 | 18,748 | 63,185 |
| Electrical Machinery; Equipment and Parts | 22,796 | 6,558 | 29,354 |
| Plastics | 12,763 | 10,157 | 22,920 |
SOURCE: Bureau of Transportation Statistics, Transborder Freight Data, https://data.bts.gov/stories/s/TransBorder-Freight-Data/myhq-rm6q/
NOTE: Numbers may not add to totals due to rounding.
Table 9. Top Five Commodities Transported between the U.S. and Mexico by Surface Modes of Transportation, 2012
(millions of current dollars)
| Commodities | Exports | Imports | Total |
|---|---|---|---|
| Electrical Machinery; Equipment and Parts | 31,542 | 54,195 | 85,737 |
| Computer-Related Machinery and Parts | 34,476 | 41,629 | 76,105 |
| Vehicles Other than Railway | 20,190 | 50,552 | 70,742 |
| Plastics | 13,776 | 3,656 | 17,432 |
| Measuring and Testing Equipment | 4,750 | 9,987 | 14,737 |
SOURCE: Bureau of Transportation Statistics, Transborder Freight Data, https://data.bts.gov/stories/s/TransBorder-Freight-Data/myhq-rm6q/
NOTE: Numbers may not add to totals due to rounding.