
2024 Annual Average Domestic Air Fare Decreases from 2023
BTS 21-25
This release is published on a fixed schedule as required by the Office of Management and Budget, and statistics in this release may be revised when inputs to the statistics are corrected or updated. Data on the program page of this website are the most up-to-date and complete. All costs are in current dollars.
2024 Annual Fare Decreases 2.3%, Adjusted for Inflation, from Previous Year
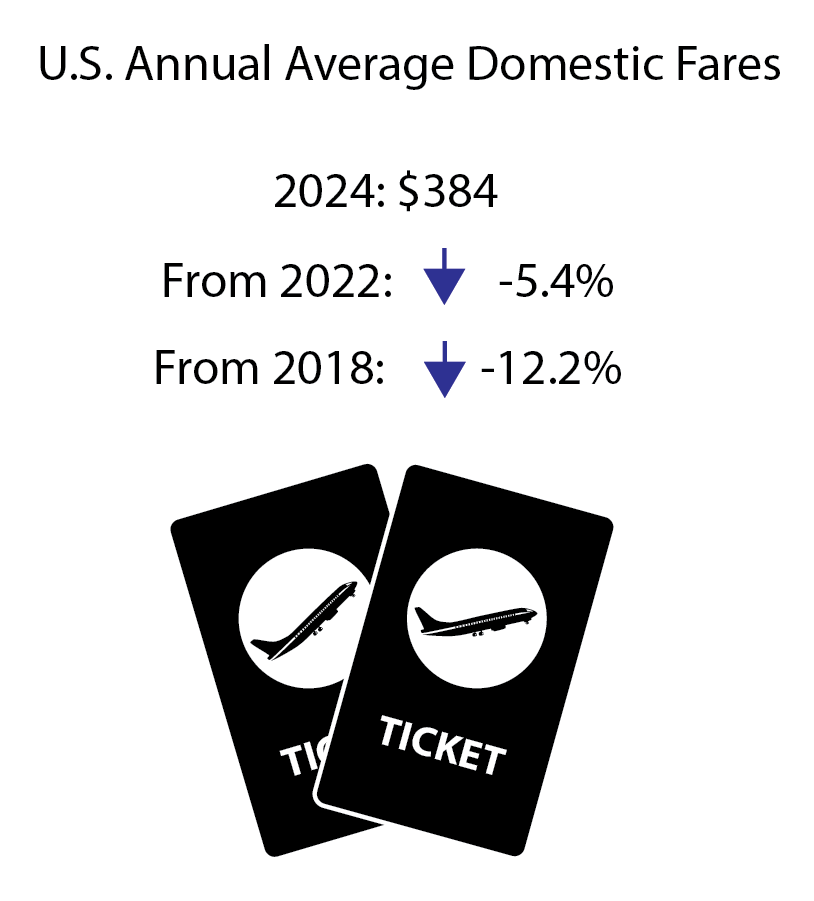
The 2024 annual average domestic itinerary air fare of $384 decreased 2.3% from the 2023 inflation-adjusted annual fare of $393.
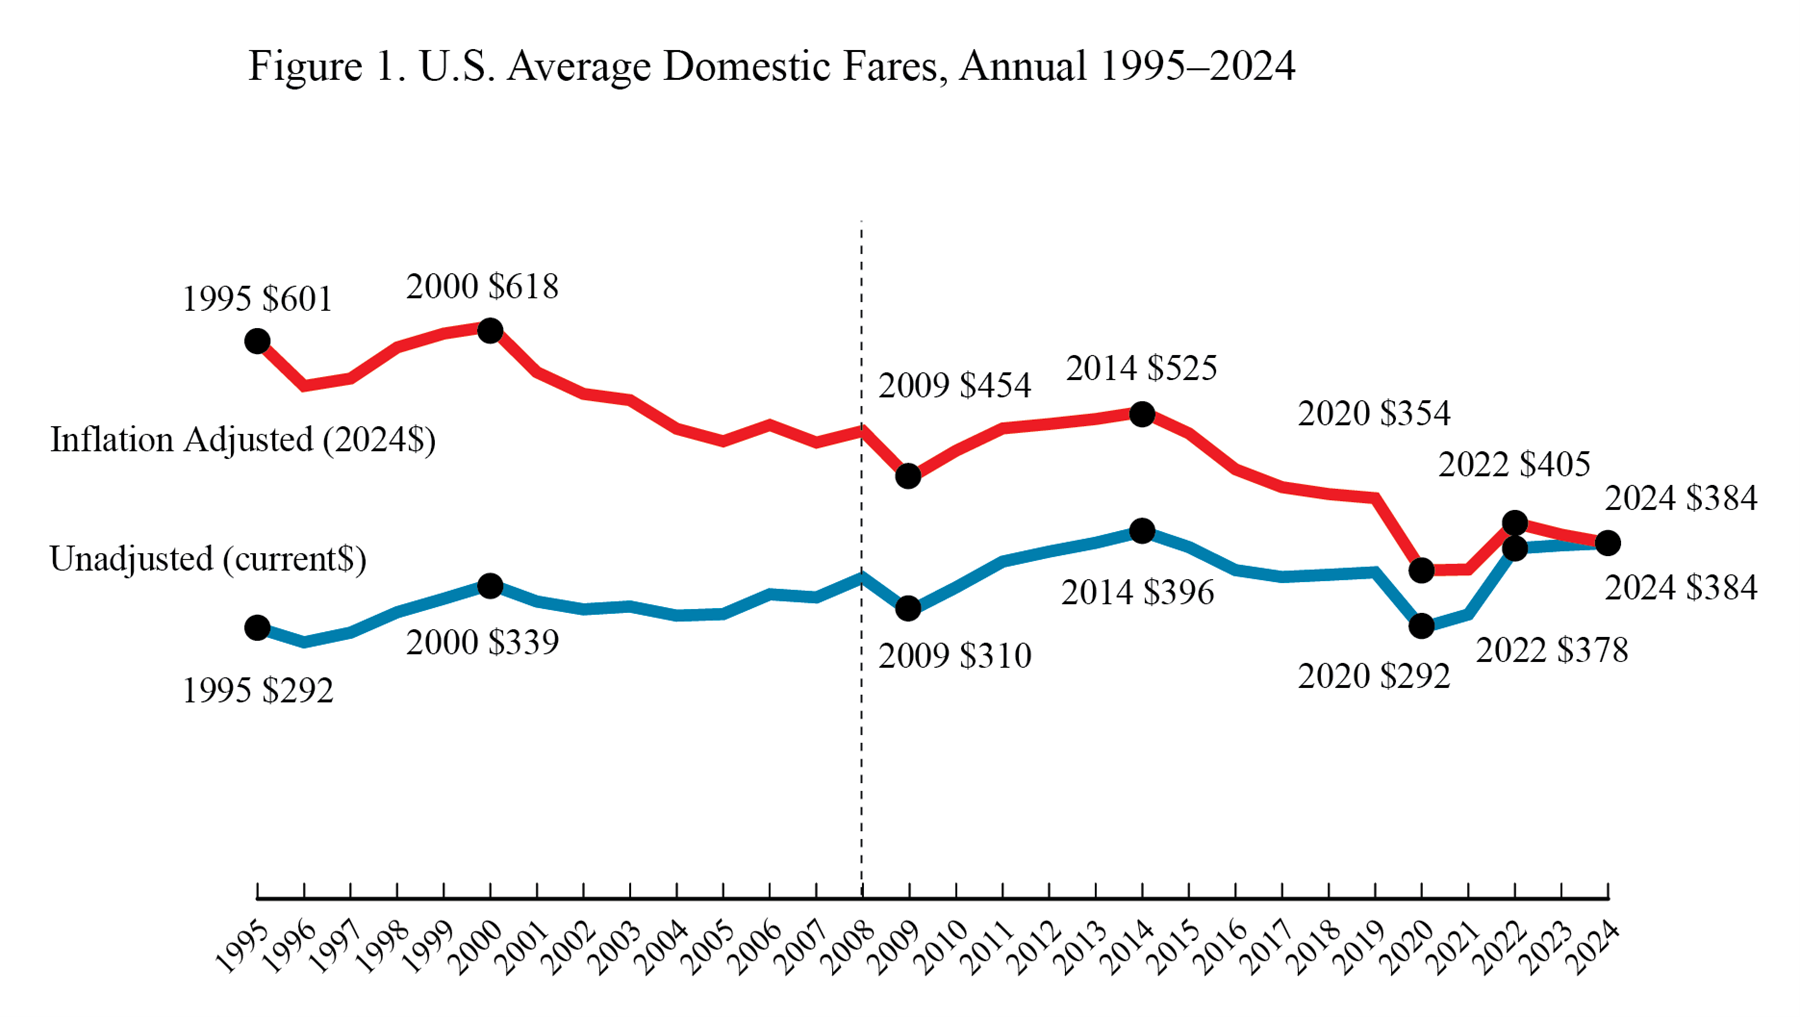
Annual Air Fares
Inflation-adjusted
Annual 2024 fare: $384
All years: Down 37.8% from the highest fare for any year, $618 in 2000
Start of BTS records in 1995: Down 36.2% from 1995 ($601)
Recent high: Down 5.3% from 2022 ($405)
Unadjusted
Annual 2024 fare: $384
From previous year: Up 0.6% from 2023 ($382)
All years: Down 3.2% from the highest fare for any year, $396 in 2014
Start of BTS records in 1995: Up 31.2% ($292) (compared to 105.9% consumer price index increase)
Recent low: Up 31.2% from 2020 ($292)
Based on a sampling of 10% of tickets.
Total ticket value: The price charged by airlines at time of ticket purchase.
Included: All fees and charges levied by an air carrier required for the passenger to board the aircraft. Also, additional taxes and fees levied by an outside entity at time of ticket purchase.
Not included: Fees for optional services, such as baggage fees.
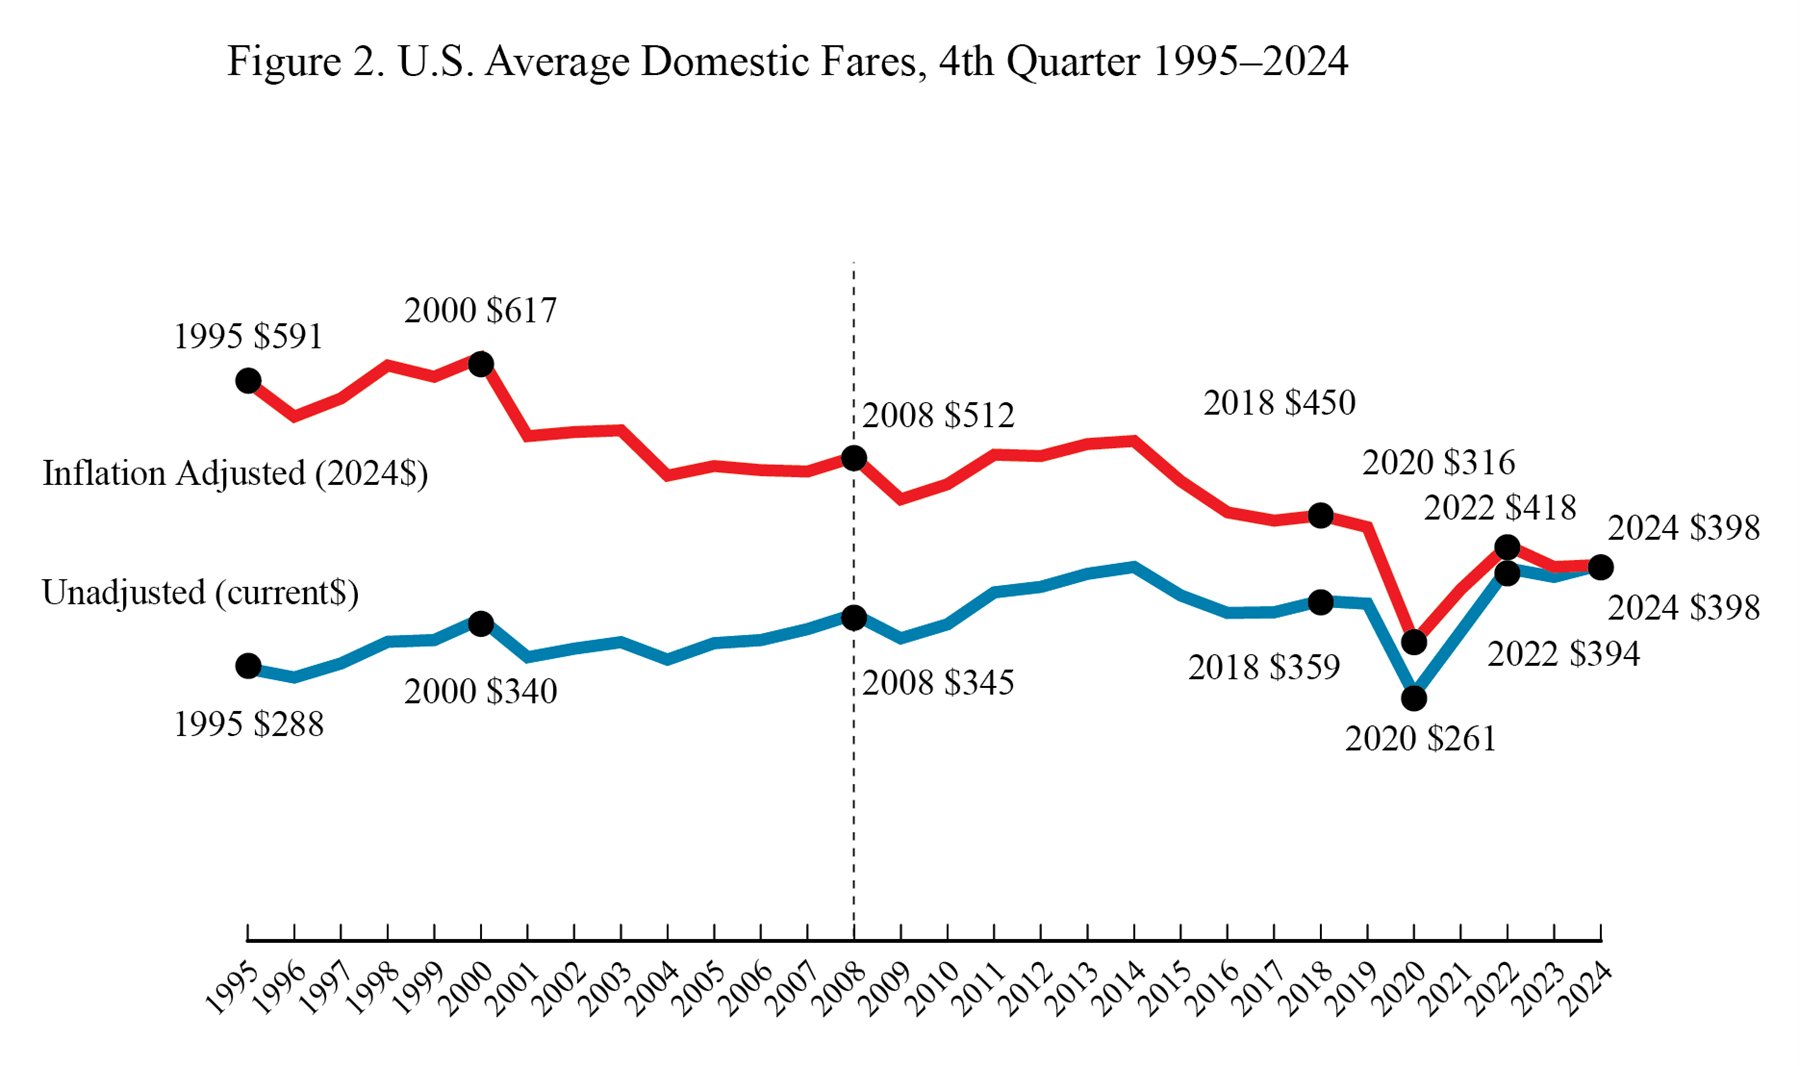
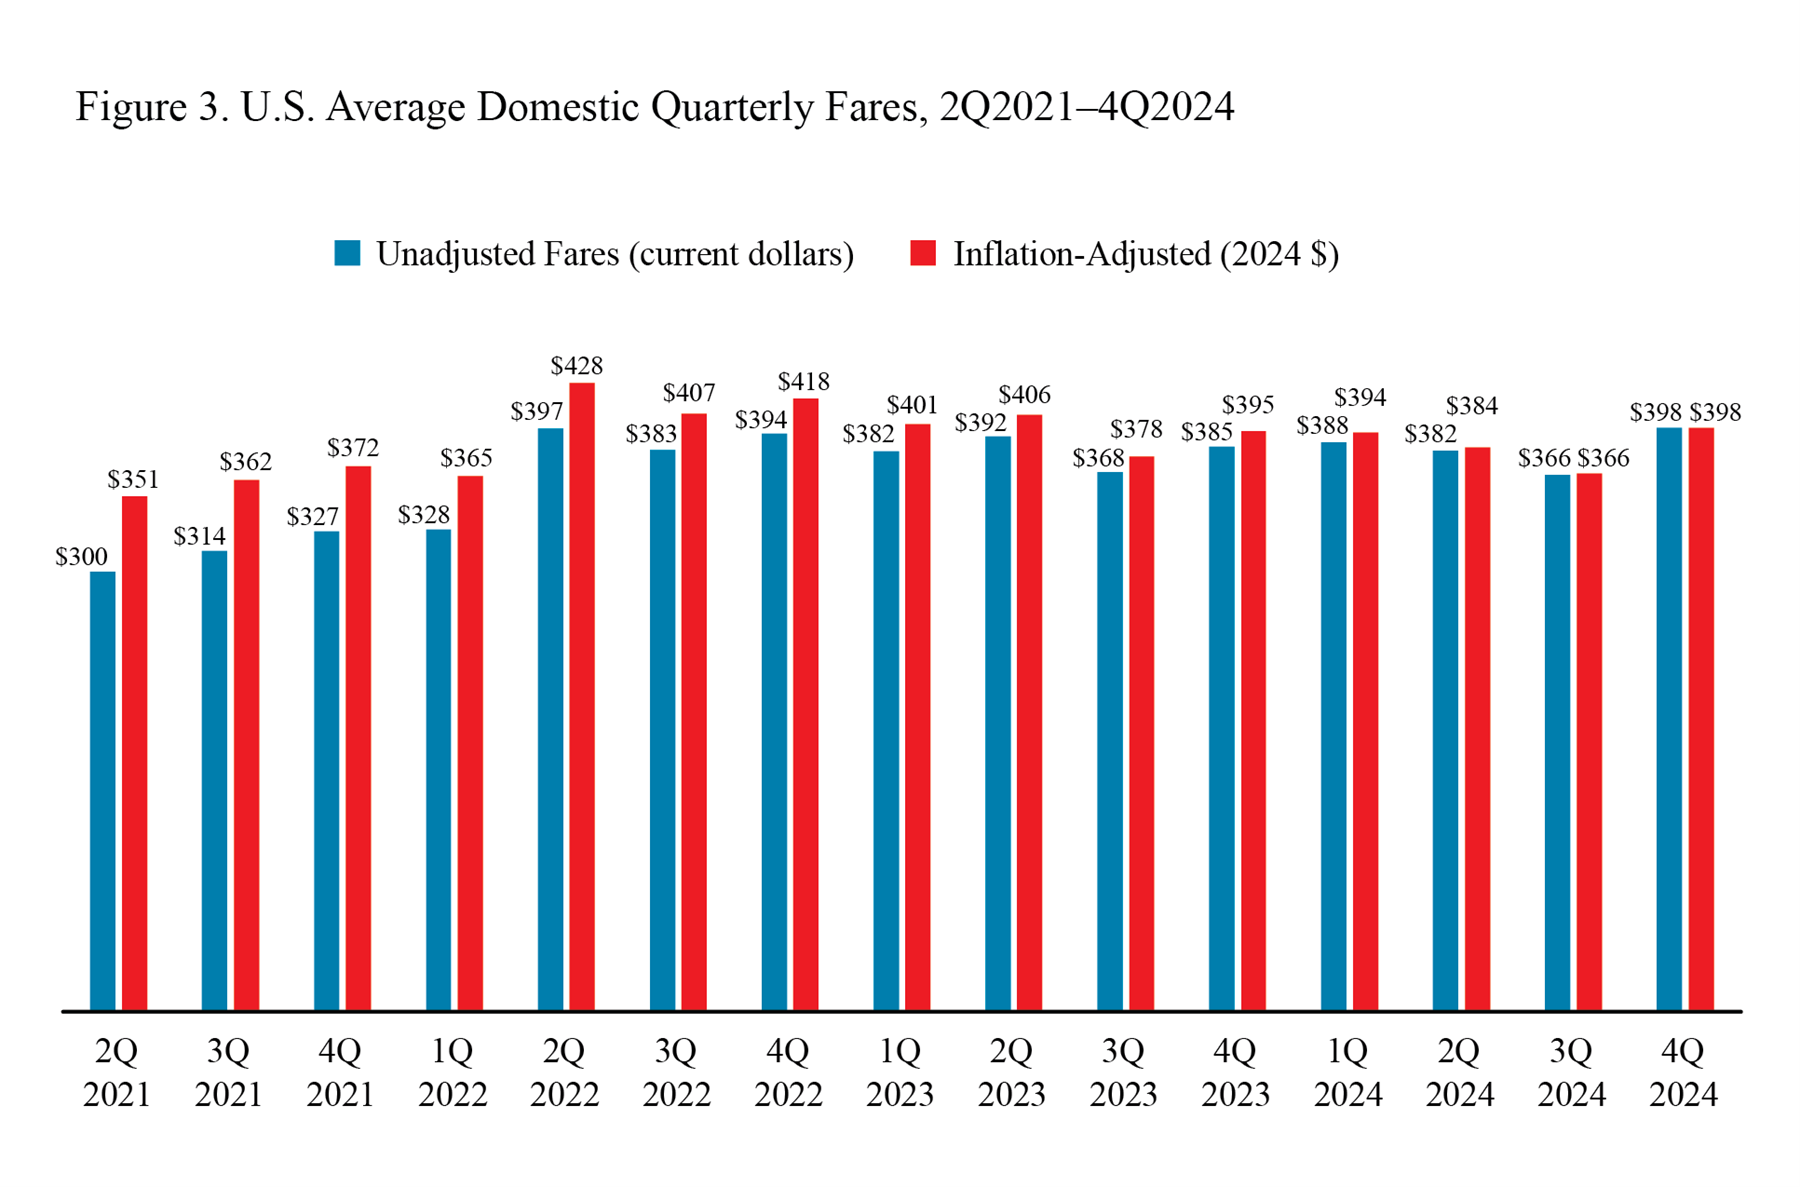
Fourth Quarter 2024 Air Fares
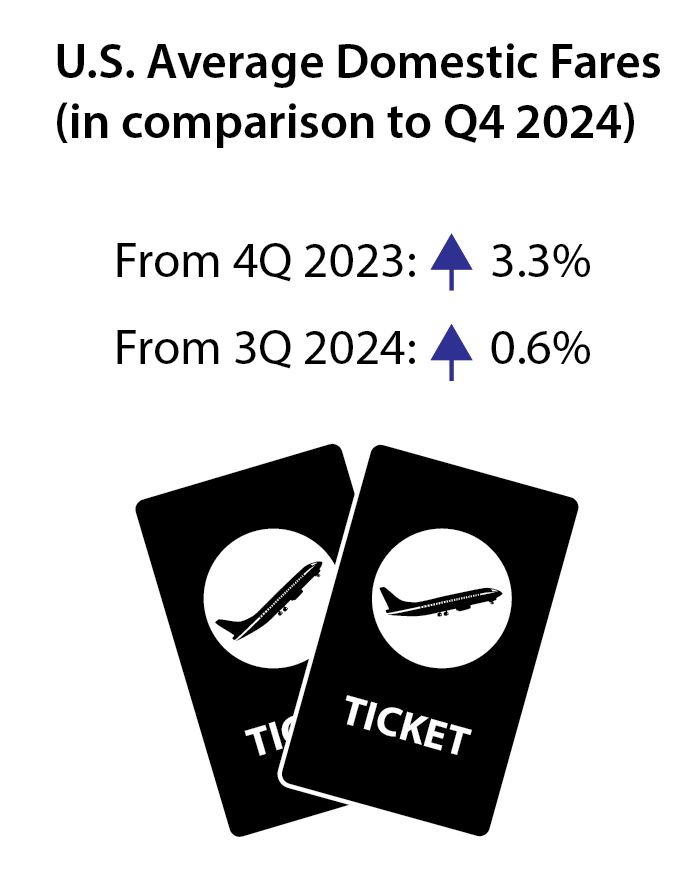
The average U.S. domestic air fare in the fourth quarter of 2024 was $398, increasing 8.5% from an inflation-adjusted third quarter 2024 fare of $366.
Itinerary Fares: Round-trips, but includes one-way tickets if no return is purchased.
Breakout of trip types: one-way, 39% ($282); round-trip, 61% ($485).
Inflation-Adjusted Average Air Fares
Fourth Quarter 2024 fare: $398
Compared to all fourth quarters: Down 35.5% from the highest 4Q fare, $617 in 2000.
Compared to all quarters: Down 37.4% from the highest fare for any quarter, $636 in 1Q 1999.
Start of BTS records in 1Q 1995: Down 36.0% ($621).
Recent high: Down 7.2% from 2Q 2022 ($428)
Recent low: Up 33.8% from 3Q 2020 ($297).
All-time low: Up 33.8% from the previous low 3Q 2020 ($297).
All-time fourth-quarter low: Up 25.9% from the previous low 4Q 2020 ($316).
Unadjusted Average Air Fares
Fourth Quarter 2024 fare: $398
Trend: Up 8.7% from 3Q 2024 ($366)
Compared to all fourth quarters: Up 0.6% from the highest 4Q fare, $395 in 2014
Compared to all quarters: Down 1.1% from the highest fare for any quarter, $402 in 2Q 2014
Start of BTS records in 1Q 1995: Up 33.9% ($297) (compared to 105.5% consumer price index increase)
Recent low: Up 62.5% from 3Q 2020 ($245)
Recent high: Down 0.6% from 2Q 2022 ($397)
All-time low: Up 62.5% from 3Q 2020 ($245)
All-time fourth-quarter low: Up 52.5% from 4Q 2020 ($261).
Fares by Airport Group

Fares by airport group:
Highest: 7 airports with 1.5-1.99 million originating passengers ($378).
Lowest: 49 airports with 100,000-499,999 originating passengers ($406).
Additional data: see Top 100 Airports or All Airports. First Quarter 2025 average fare data will be released July 15.
To receive updates from BTS directly to your email, please consider subscribing to our GovDelivery service.