
Air Cargo Down 5% Between the U.S. and Foreign Points, June 2020 (Preliminary)
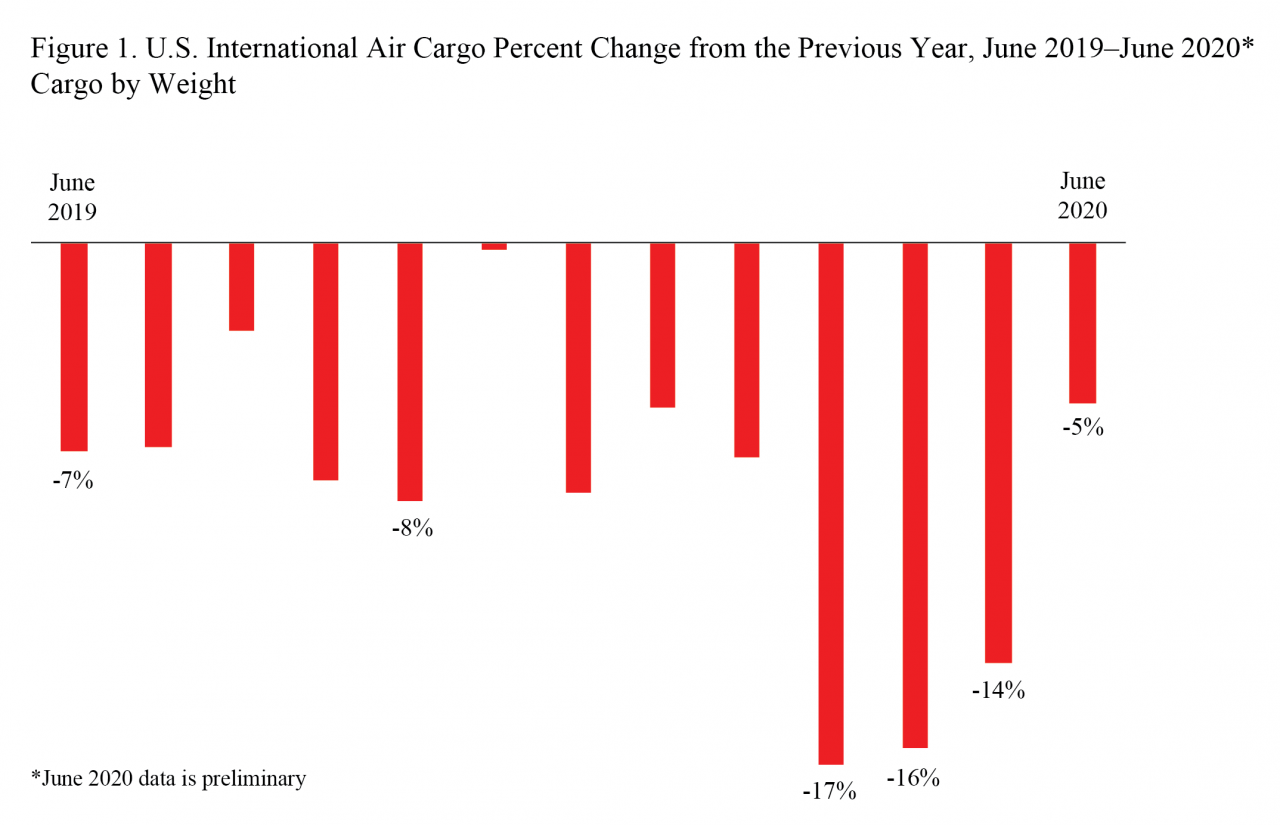
U.S. and foreign airlines carried 5% less cargo by weight between the U.S. and foreign points in June 2020 than in June 2019, despite a rise of almost 11% in cargo between the U.S. and Asia, according to data filed with the Bureau of Transportation Statistics (BTS) by large air carriers. June’s decline was smaller than year-over-year decreases in March (down 17%), April (down 16%) and May (down 14%).
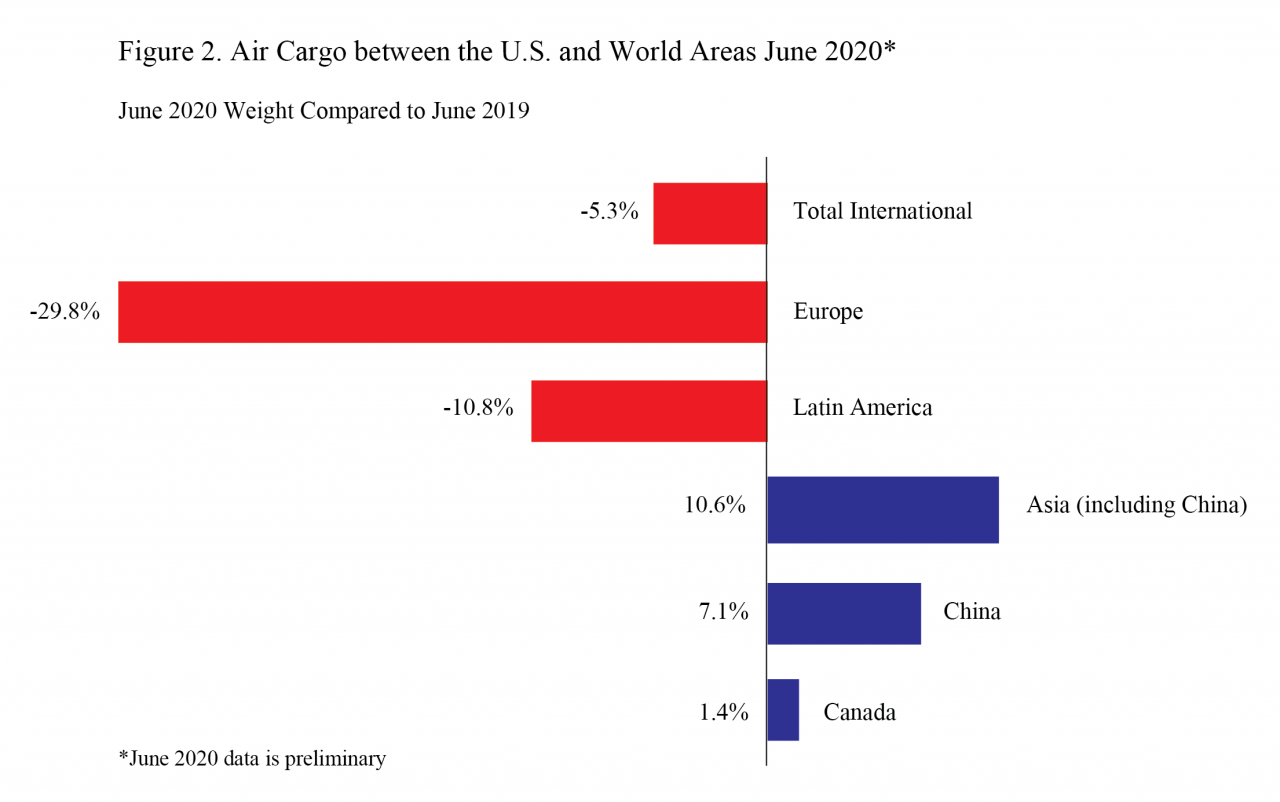
June 2020 (preliminary) cargo numbers to and from the U.S. by world geographic areas (by weight):
- Total to and from the U.S.: 740 thousand tons, down 5.3% from June 2019 (781T tons)
- Europe: 139 thousand tons, down 29.8% from June 2019 (198T tons)
- Latin America: 89 thousand tons, down 10.8% from June 2019 (100T tons)
- Asia (including China): 380 thousand tons, up 10.6% from June 2019 (344T tons)
- China: 81 thousand tons, up 7.1% from June 2019 (75T tons)
- Canada: 23.4 thousand tons, up 1.4% from June 2019 (23.1T tons)
The total to and from the U.S. includes world areas that are not shown separately.
Air cargo reports are filed monthly with BTS. Final June data will be released on Sept. 11. Cargo data in this release are limited to shipments between the U.S. and foreign points. Due to confidentiality requirements, public access to international origin and destination data of U.S. and foreign air carriers is restricted for a period of six months from the data date. Complete international data will be released on Dec. 10. Numbers in this release are based on world area codes.
Total Air Cargo to and from the U.S.
The 5.3% decline (preliminary) between June 2019 and June 2020 in the weight of cargo carried on U.S. and foreign airlines between the U.S. and foreign points was driven by annual declines in cargo with Europe (down 29.8%) and Latin America (down 10.8%). These declines offset the year-to-year rise in cargo with Asia (up 10.6%), the region with most U.S.-based cargo. The Asian cargo increases primarily took place outside of China where there was a smaller 7.1% rise in cargo with the U.S. The June annual decrease was the smallest since November 2019 (-0.2%)
| 2016-2017 | 2017-2018 | 2018-2019 | 2019-2020 | |
|---|---|---|---|---|
January | 8.5 | 13.8 | -2.2 | -5.4 |
February | 8.0 | 13.6 | -5.4 | -7.0 |
March | 10.2 | 11.6 | -1.9 | -17.0 |
April | 7.1 | 11.6 | -8.2 | -16.5 |
May | 12. | 11.3 | -6.2 | -13.7 |
June | 12.1 | 8.6 | -6.8 | -5.3* |
July | 13.5 | 3.2 | -6.6 | |
August | 13.6 | 5.1 | -2.9 | |
September | 10.0 | 5.7 | -7.7 | |
October | 12.2 | 2.0 | -8.4 | |
November | 17.9 | -9.4 | -0.2 | |
December | 14.1 | -1.7 | -8.1 | |
| Annual | 11.8 | 5.7 | -5.4 |
See the tables that accompany this release on the BTS website for year-to-year changes since 2017 for Europe, Latin America, Asia (including China), China and Canada.
Europe
U.S.-Europe cargo declined 29.8% (preliminary) from June 2019 following larger declines of 42.9% in April (42.9%) and May (37.7%). U.S.-Europe cargo has declined from the same month of the previous year for 17 consecutive months with the largest decreases in the four months from March through June 2020.
Latin America
Cargo with Latin America declined 10.8% in June (preliminary) following a larger 22.7% annual decline in May. The May decline was the largest of the six consecutive annual decreases this year.
Asia (including China)
The June annual increase of 10.6% (preliminary) of cargo with Asia (including China) was the third consecutive rise following seven consecutive year-to-year declines. It was the largest year-to-year increase since April 2018. Asia cargo comprised 51% of total U.S. international air cargo in June.
China
The 7.1% rise in U.S.-China air cargo shipments from June 2019 to June 2020, followed a small annual decrease in May (-0.1%). Before May, U.S.-China air cargo decreased by at least 10% from the same month of the previous year for four consecutive months. During June 2020, 87.8% of the freight was flown from China to the U.S. while 12.2% was carried from the U.S. to China.
Canada
The 1.4% (preliminary) year-to-year increase in the weight of cargo carried on U.S. and foreign airlines between the U.S. and Canada followed four consecutive year-to-year decreases. During June 2020, 58.7% of the cargo was flown from Canada to the U.S. while 41.3% was carried from the U.S. to Canada.
Reporting Notes
Data are compiled from monthly reports filed with BTS by commercial U.S. air carriers detailing operations, passenger traffic and cargo traffic. This release includes data received by BTS from 32 U.S. and foreign airlines as of Aug. 11.
See the BTS Airlines and Airports page for additional U.S. airlines numbers through May for U.S. airlines. International data by origin and destination is available through February.
None of the data are from samples. Measures of statistical significance do not apply to the complete air traffic data.