
Annual and Fourth-Quarter 2019 Air Fare Data
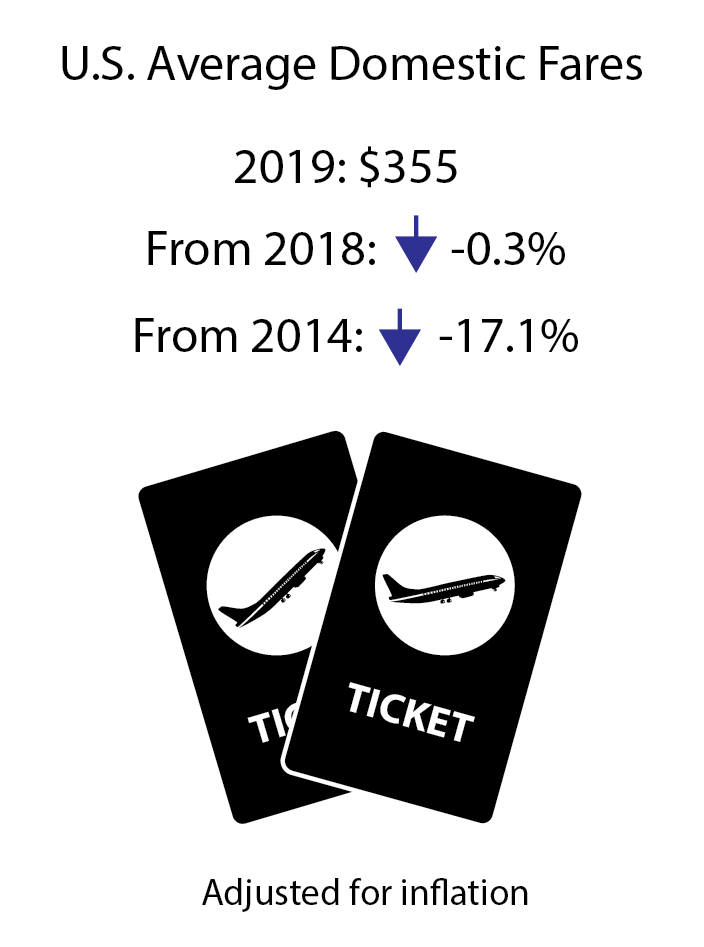
The 2019 average domestic itinerary air fare of $355 was the lowest inflation-adjusted annual fare since the Bureau of Transportation Statistics began collecting such records in 1995, down 0.3% from the previous low of $356 in 2018.
During the year, fares dropped in the third quarter to $346, inflation-adjusted, the lowest quarterly fare on record. In the fourth quarter, fares rose to $357, up 2.1% from the $349 fare in the fourth quarter of 2018.
Annual Air Fares
Figure 1. U.S. Average Domestic Annual Fares, 1995-2019
| Unadjusted Fares (current dollars) | Inflation-Adjusted (2019 $) | 1 | |
|---|---|---|---|
| 1995 | 292 | 490 | 2 |
| 1996 | 277 | 451 | 3 |
| 1997 | 287 | 458 | 4 |
| 1998 | 309 | 485 | 5 |
| 1999 | 324 | 497 | 6 |
| 2000 | 339 | 503 | 7 |
| 2001 | 321 | 463 | 8 |
| 2002 | 312 | 444 | 9 |
| 2003 | 315 | 438 | 10 |
| 2004 | 305 | 413 | 11 |
| 2005 | 307 | 402 | 12 |
| 2006 | 329 | 417 | 13 |
| 2007 | 325 | 401 | 14 |
| 2008 | 346 | 411 | 15 |
| 2009 | 310 | 370 | 16 |
| 2010 | 336 | 394 | 17 |
| 2011 | 364 | 414 | 18 |
| 2012 | 375 | 417 | 19 |
| 2013 | 384 | 422 | 20 |
| 2014 | 396 | 428 | 21 |
| 2015 | 379 | 409 | 22 |
| 2016 | 350 | 373 | 23 |
| 2017 | 347 | 362 | 24 |
| 2018 | 350 | 356 | 25 |
| 2019 | 355 | 355 | 26 |
| 27 |
Bureau of Transportation Statistics, Origin and Destination Survey
Other Revenue: In recent years, airlines increasingly obtained additional revenue from passenger fees, as well as from other sources. U.S. passenger airlines collected 73.7% of total operating revenue of $108.7 billion from passenger fares during the first nine months of 2019, down from 87.6% in 1995.
Results for average fares are based on the BTS Origin & Destination Survey, a 10% sample of airline tickets used during the quarter. For results based on all itinerary fares for 2019, the standard error is 0.18. The median fare for the year was $293.00.
Fourth Quarter 2019 Air Fares
U.S. domestic air fares in the fourth quarter of 2019 was $357. This average fare was the all-time low for any fourth quarter, inflation-adjusted, down 1.9% from the previous low in 2017.
Adjusted for inflation, (constant 2019 dollars) the 4Q 2019 air fare was:
- Down 2.7% from 4Q 2018 ($366)
- Up 3.1% from 3Q 2019 ($346)
- Down 16.5% from 4Q 2014 ($427)
Figure 2. Fares by Airport Group based on Number of Originating Domestic Passengers 4Q 2019
| Originating Domestic Passengers | 4Q Fares (current dollars) | 1 |
|---|---|---|
| 2M+ | $368 | 2 |
| 1.5M-2M | $337 | 3 |
| 1M-1.5M | $346 | 4 |
| 500K-1M | $346 | 5 |
| 100K-500K | $360 | 6 |
| Top 100 Airports | $353 | 7 |
| All Airports | $357 | 8 |
| 9 |
Bureau of Transportation Statistics, Origin and Destination Survey
Additional data: see Top 100 Airports or All Airports. First Quarter 2020 average fare data will be released July 21.
Standard error: Results for average fares are based on the BTS Origin & Destination Survey, a 10% sample of airline tickets used during the quarter. Averages for airports with smaller samples may be less reliable.
Note: Results for average fares are based on the BTS Origin & Destination Survey, a 10% sample of airline tickets used during the quarter. For Q4 2019 results based on all itinerary fares, the standard error is 0.31 and the median fare is $296.00. The 90% confidence interval ranges from $356.07 to $356.97. For results based on round-trip fares, the standard error is 0.38 and the median fare is $370. The 90% confidence interval ranges from $428.04 to $429.16. For results based on one-way fares, the standard error is 0.27 and the median fare is $199. The 90% confidence interval ranges from $252.75 to $253.89.