
Annual Rise in U.S. Airlines June Cargo (Over 9%) Largest Increase Since January 2018
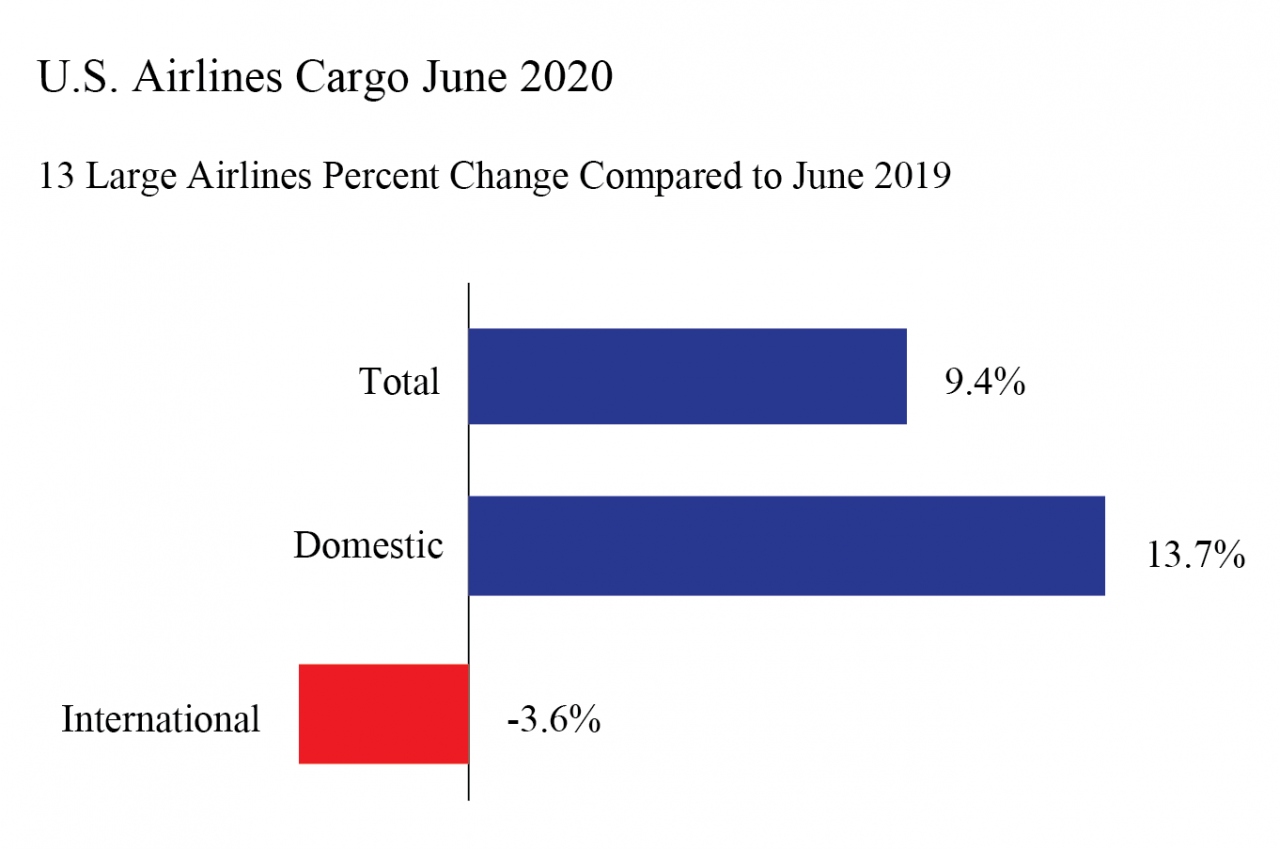
U.S. airlines carried 9.4% more cargo by weight in June 2020 than in June 2019, the largest annual gain since January 2018 fueled by a gain of almost 14% in domestic cargo. A 3.6% decline in international cargo was the smallest annual loss since November 2019, according to preliminary data filed with the Bureau of Transportation Statistics (BTS) by 13 of the leading cargo airlines.
The 13 airlines carry more than 90% of the total cargo by weight on U.S. airlines. Cargo data consists of freight and mail carried within the U.S. and between the U.S. and foreign points.
June 2020 preliminary air cargo numbers for 13 U.S. carriers:
- Total: 1,358 thousand tons, up 9.4% from June 2019 (1,241T tons)
- Domestic: 1,065 thousand tons, up 13.7% from June 2019 (937T tons)
- International: 293 thousand tons, down 3.6% from June 2019 (304T tons)
U.S. airline cargo reports are filed monthly with BTS. Final June data will be released on Sept. 11. Complete international data by origin and destination, which is under a six-month confidentiality restriction, will be released on Dec. 10.
Systemwide Cargo (Domestic + International)
June 2020 was the second consecutive month that U.S. airlines carried more total cargo than they did during the same month of the previous year. The annual increases in May and June followed four straight months of declines from the previous year.
2016-2017 | 2017-2018 | 2018-2019 | 2019-2020 | |
|---|---|---|---|---|
January | 6.4 | 10.5 | 5.1 | -0.5 |
February | 6.1 | 9.2 | -0.3 | -0.1 |
March | 8.0 | 5.8 | -0.2 | -1.6 |
April | 2.6 | 5.9 | 4.4 | -1.9 |
May | 10.8 | 9.0 | 3.1 | 0.9 |
June | 6.8 | 5.5 | -1.1 | 9.4* |
July | 6.9 | 6.7 | 3.5 | |
August | 9.7 | 5.0 | 0.2 | |
September | 4.3 | 5.0 | -4.4 | |
October | 10.6 | 5.5 | -1.2 | |
November | 10.6 | -0.6 | -2.3 | |
December | 5.6 | 0.3 | 0.7 | |
Jan-June | 6.8 | 7.5 | -1.0 | 0.8 |
| Annual | 7.4 | 5.4 | 0.6 |
Source: Bureau of Transportation Statistics, T-100 Market
* June 2020 data is preliminary
Domestic Cargo
June 2020 was the seventh consecutive month that domestic cargo shipments on U.S. airlines rose from the same month of the previous year. The 13.7% annual increase was the largest in more than three years.
2016-2017 | 2017-2018 | 2018-2019 | 2019-2020 | |
|---|---|---|---|---|
January | 4.6 | 10.4 | 6.1 | 2.8 |
February | 4.9 | 8.7 | 0.7 | 2.2 |
March | 7.1 | 4.0 | -0.4 | 3.1 |
April | 1.5 | 4.9 | 7.7 | 3.1 |
May | 10.8 | 8.9 | 4.5 | 4.2 |
June | 5.4 | 4.5 | 0.5 | 13.7* |
July | 5.2 | 6.7 | 6.2 | |
| August | 9.4 | 4.8 | 0.1 | |
| September | 3.3 | 4.3 | -2.9 | |
| October | 11.1 | 5.7 | 1.8 | |
| November | 11.3 | -0.1 | -1.8 | |
| December | 5.1 | 0.1 | 4.5 | |
| Jan-June | 5.7 | 6.8 | 0.7 | 4.7 |
| Annual | 6.7 | 5.0 | 2.2 |
Source: Bureau of Transportation Statistics, T-100 Domestic Market
* June 2020 data is preliminary
International Cargo
U.S. airlines cargo shipments declined 3.6% by weight (preliminary) from June 2019 to June 2020, the 10th consecutive year-to-year decrease. The annual decline in May was less than the annual declines in March (13.9%), April (15.7%) and May (8.3%). It was the smallest annual decline since November 2019.
2016-2017 | 2017-2018 | 2018-2019 | 2019-2020 | |
|---|---|---|---|---|
January | 11.4 | 10.6 | 2.2 | -9.8 |
| February | 9.6 | 10.4 | -3.1 | -6.3 |
| March | 10.5 | 10.7 | 0.4 | -13.9 |
| April | 5.3 | 8.2 | -3.9 | -15.7 |
| May | 11.0 | 9.2 | -0.6 | -8.3 |
| June | 10.8 | 8.2 | -5.2 | -3.6* |
| July | 11.3 | 6.7 | -3.6 | |
| August | 10.6 | 5.6 | 0.4 | |
| September | 7.2 | 7.0 | -8.3 | |
| October | 9.4 | 5.0 | -8.7 | |
| November | 8.8 | -1.8 | -3.5 | |
| December | 7.2 | 0.9 | -10.6 | |
| Jan-June | 9.5 | 9.8 | -6.4 | -10.3 |
| Annual | 9.4 | 6.5 | -3.8 |
Source: Bureau of Transportation Statistics, T-100 International Market
* June 2020 data is preliminary
Reporting Notes
Data are compiled from monthly reports filed with BTS by commercial U.S. air carriers detailing operations, passenger traffic and freight traffic. This release includes data received by BTS from 13 U.S. airlines as of Aug. 4.
See the BTS Airlines and Airports page for additional U.S. airlines numbers through April for U.S. airlines. International data by origin and destination is available through January.
None of the data are from samples. Measures of statistical significance do not apply to the complete air traffic data.