
Annual Rise in U.S. Airlines May Domestic Cargo (Almost 5%) Largest Increase Since July 2019
U.S. airlines carried 4.7% more domestic cargo by weight in May 2020 than in May 2019, the largest annual gain since July 2019 while the 8.4% decline in international cargo was the smallest annual loss since February, according to preliminary data filed with the Bureau of Transportation Statistics (BTS) by 15 of the leading cargo airlines.
The 15 airlines carry more than 95% of the total cargo by weight on U.S. airlines. Cargo data consists of freight and mail carried within the U.S. and between the U.S. and foreign points.
May 2020 preliminary air cargo numbers for the top 15 U.S. carriers:
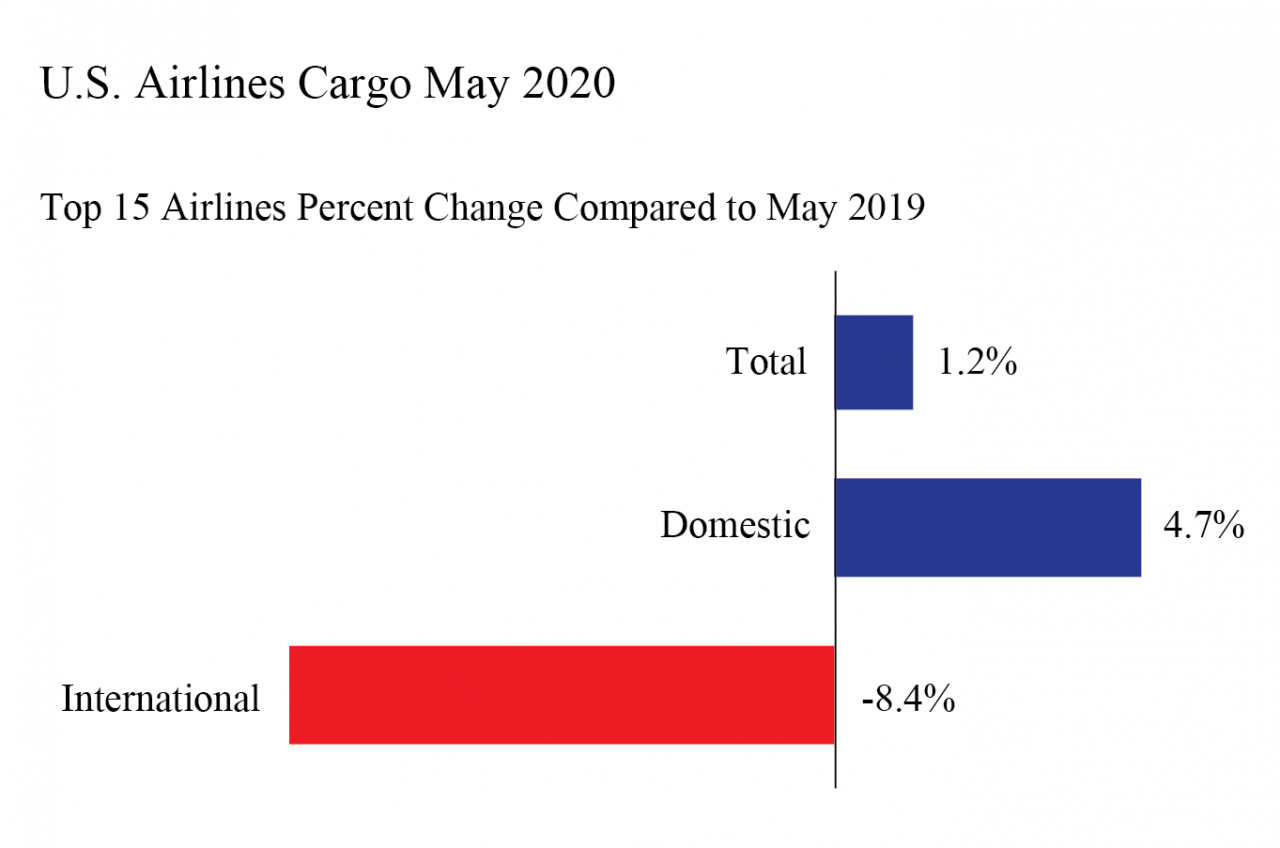
- Total: 1,532 thousand tons, up 1.2% from May 2019 (1,514T tons)
- Domestic: 1,163 thousand tons, up 4.7% from May 2019 (1,111T tons)
- International: 403 thousand tons, down 8.4% from May 2019 (369T tons)
U.S. air cargo reports are filed monthly with BTS. Final May data will be released on Aug. 13. Complete international data by origin and destination will be released on Nov. 13.
Systemwide Cargo (Domestic + International)
May 2020 would be the first month since December 2019 that U.S. airlines carried more total cargo than they did during the same month of the previous year. The 1.2% preliminary increase from May 2019, driven by the 4.7% increase in domestic cargo, was the second year-to-year rise in the last nine months.
2016-2017 | 2017-2018 | 2018-2019 | 2019-2020 | |
|---|---|---|---|---|
January | 6.4 | 10.5 | 5.1 | -0.5 |
February | 6.1 | 9.2 | -0.3 | -0.1 |
March | 8.0 | 5.8 | -0.2 | -1.6 |
April | 2.6 | 5.9 | 4.4 | -1.9 |
May | 10.8 | 9.0 | 3.1 | 1.2* |
June | 6.8 | 5.5 | -1.1 | |
July | 6.9 | 6.7 | 3.5 | |
August | 9.7 | 5.0 | 0.2 | |
September | 4.3 | 5.0 | -4.4 | |
October | 10.6 | 5.5 | -1.2 | |
November | 10.6 | -0.6 | -2.3 | |
December | 5.6 | 0.3 | 0.7 | |
| Annual | 7.4 | 5.4 | 0.6 |
Source: Bureau of Transportation Statistics, T-100 Market
* May 2020 data is preliminary
Domestic Cargo
May 2020 would be the sixth consecutive month that domestic cargo shipments on U.S. airlines rose from the same month of the previous year. The 4.7% annual increase would be the largest annual increase during those six months and the largest since a 6.2% rise in July 2019.
2016-2017 | 2017-2018 | 2018-2019 | 2019-2020 | |
|---|---|---|---|---|
January | 4.6 | 10.4 | 6.1 | 2.8 |
February | 4.9 | 8.7 | 0.7 | 2.2 |
March | 7.1 | 4.0 | -0.4 | 3.1 |
April | 1.5 | 4.9 | 7.7 | 3.1 |
May | 10.8 | 8.9 | 4.5 | 4.7* |
June | 5.4 | 4.5 | 0.5 | |
July | 5.2 | 6.7 | 6.2 | |
August | 9.4 | 4.8 | 0.1 | |
September | 3.3 | 4.3 | -2.9 | |
October | 11.1 | 5.7 | 1.8 | |
November | 11.3 | -0.1 | -1.8 | |
December | 5.1 | 0.1 | 4.5 | |
Annual | 6.7 | 5.0 | 2.2 |
Source: Bureau of Transportation Statistics, T-100 Domestic Market
* May 2020 data is preliminary
International Cargo
U.S. airlines cargo shipments declined 8.4% by weight (preliminary) from May 2019 to May 2020, the ninth consecutive year-to-year decrease. The annual decline in May was less than the annual declines in March (13.9%) and April (15.7%).
2016-2017 | 2017-2018 | 2018-2019 | 2019-2020 | |
|---|---|---|---|---|
January | 11.4 | 10.6 | 2.2 | -9.8 |
February | 9.6 | 10.4 | -3.1 | -6.3 |
March | 10.5 | 10.7 | 0.4 | -13.9 |
April | 5.3 | 8.2 | -3.9 | -15.7 |
May | 11.0 | 9.2 | -0.6 | -8.4* |
June | 10.8 | 8.2 | -5.2 | |
July | 11.3 | 6.7 | -3.6 | |
August | 10.6 | 5.6 | 0.4 | |
September | 7.2 | 7.0 | -8.3 | |
October | 9.4 | 5.0 | -8.7 | |
November | 8.8 | -1.8 | -3.5 | |
December | 7.2 | 0.9 | -10.6 | |
Annual | 9.4 | 6.5 | -3.8 |
Source: Bureau of Transportation Statistics, T-100 International Market
* May 2020 data is preliminary
Reporting Notes
Data are compiled from monthly reports filed with BTS by commercial U.S. air carriers detailing operations, passenger traffic and freight traffic. This release includes data received by BTS from 15 U.S. airlines as of July 15.
See the BTS Airlines and Airports page for additional U.S. airlines numbers through April for U.S. airlines. International data by origin and destination is available through January.
None of the data are from samples. Measures of statistical significance do not apply to the complete air traffic data.