


April 2026 U.S. Airline Traffic Data Virtually Unchanged from the Same Month Last Year
BTS 26-58
This release is published on a fixed schedule as required by the Office of Management and Budget, and statistics in this release may be revised when inputs to the statistics are corrected or updated. Data on the program page of this website are the most up-to-date and complete.
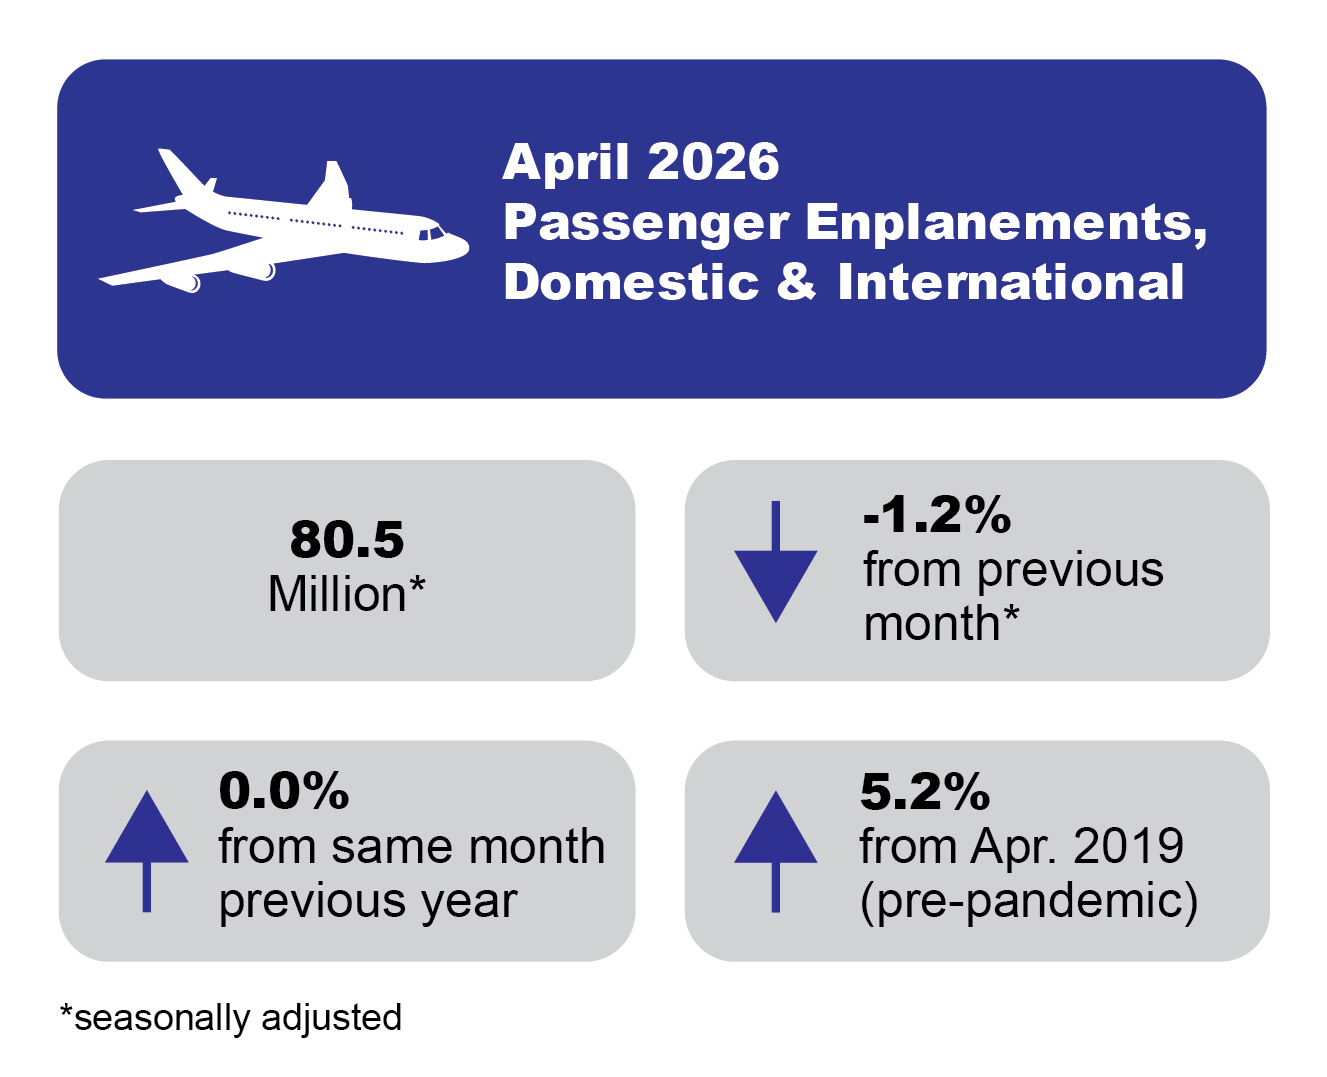
U.S. airlines carried 80.4 million systemwide (domestic and international) scheduled service passengers in April 2026, according to the Bureau of Transportation Statistics (BTS). When adjusted for seasonality, April enplanements are down 1.2% from March and down 3.3% from the all-time high reached in June 2024.
BTS reported 69.8 million domestic passengers and 10.6 million international passengers on U.S. airlines flights in April, not adjusting for seasonality.
U.S. airline traffic reports are filed monthly with BTS. See the tables that accompany this release on the BTS website for summary data since 2016 (Tables 1-24) and complete data since 2000.
Trends (not seasonally adjusted) in U.S. airlines passenger enplanements
April unadjusted
- Systemwide enplanements (80.4M) were down 1.1% from the all-time April high (81.2) reached in 2024.
- Domestic enplanements (69.8M) were down 1.1% from the all-time April high (70.6) reached in 2024.
- International enplanements (10.58M) were down 1.9% from the all-time April high (10.79) reached in 2025.
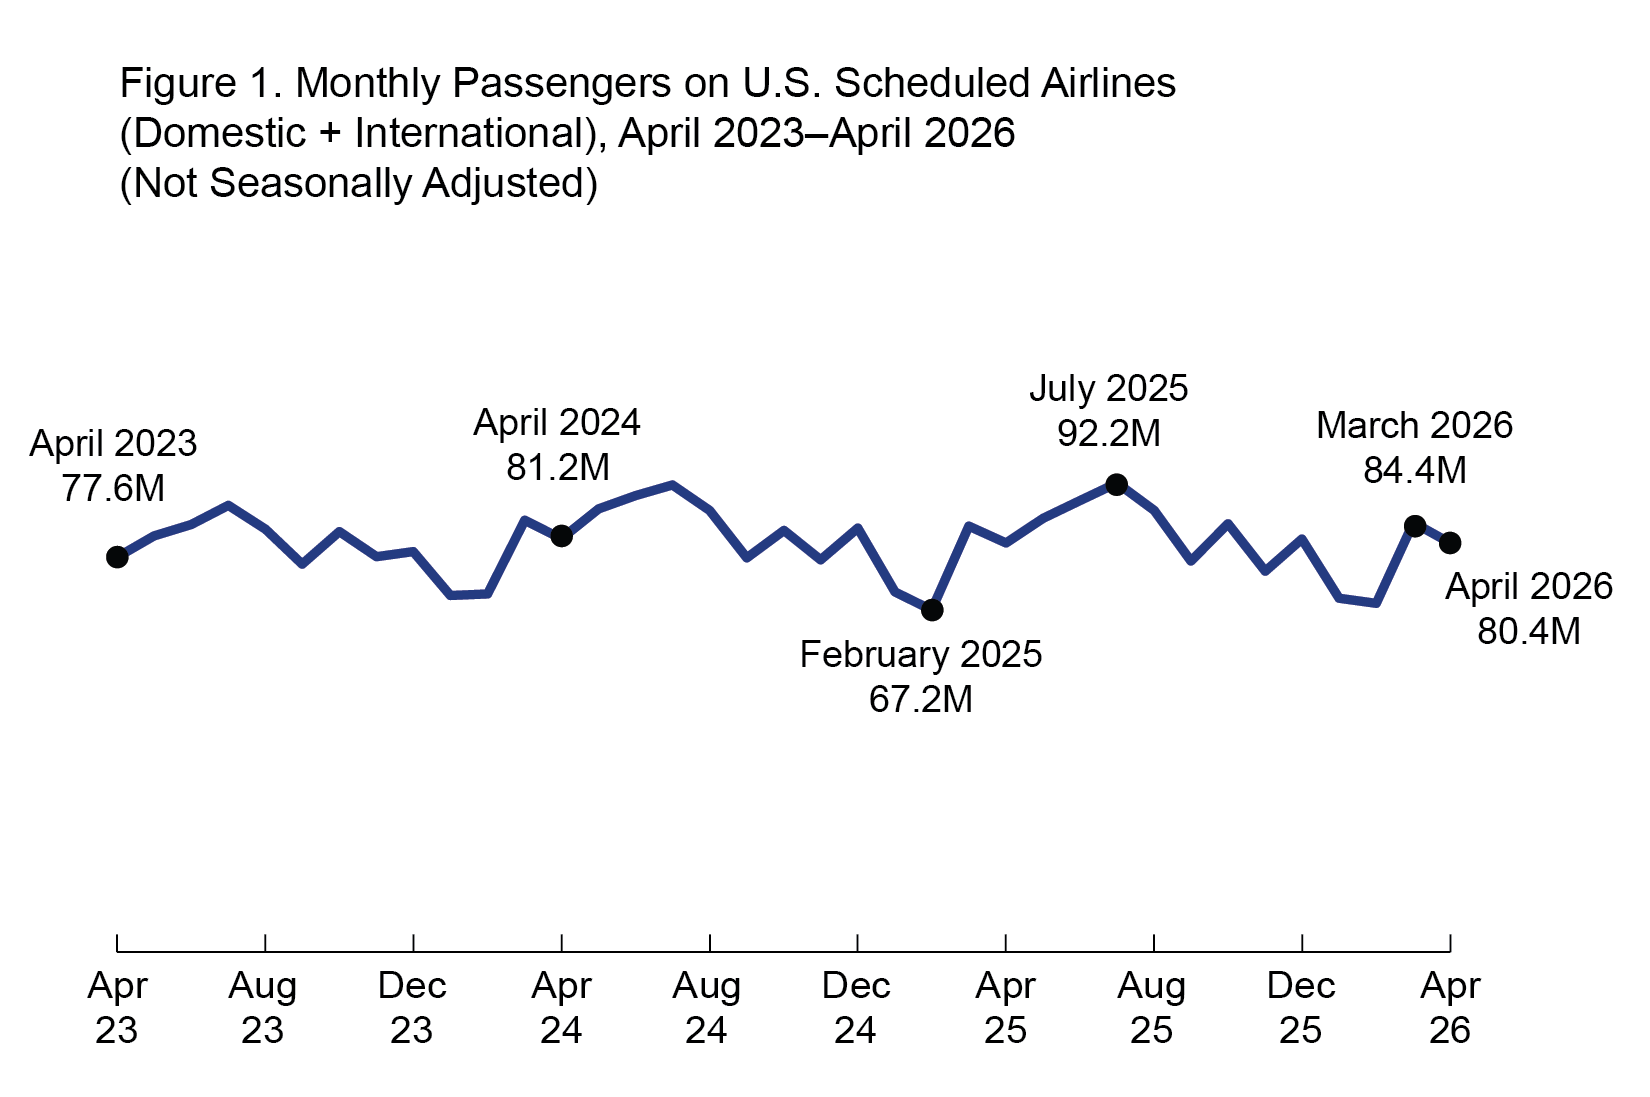
Monthly Passengers on U.S. Scheduled Airlines (Domestic + International), April 2023 - April 2026
| Month | Domestic + International passengers |
|---|---|
| Apr-23 | 77.6 |
| May-23 | 81.8 |
| Jun-23 | 84.0 |
| Jul-23 | 87.8 |
| Aug-23 | 83.1 |
| Sep-23 | 76.3 |
| Oct-23 | 82.6 |
| Nov-23 | 77.7 |
| Dec-23 | 78.7 |
| Jan-24 | 70.1 |
| Feb-24 | 70.4 |
| Mar-24 | 84.9 |
| Apr-24 | 81.2 |
| May-24 | 87.1 |
| Jun-24 | 89.7 |
| Jul-24 | 91.8 |
| Aug-24 | 86.8 |
| Sep-24 | 77.5 |
| Oct-24 | 82.8 |
| Nov-24 | 77.1 |
| Dec-24 | 83.3 |
| Jan-25 | 70.7 |
| Feb-25 | 67.2 |
| Mar-25 | 83.7 |
| Apr-25 | 80.4 |
| May-25 | 85.3 |
| Jun-25 | 88.7 |
| Jul-25 | 92.2 |
| Aug-25 | 86.8 |
| Sep-25 | 76.8 |
| Oct-25 | 84.2 |
| Nov-25 | 74.8 |
| Dec-25 | 81.2 |
| Jan-26 | 69.5 |
| Feb-26 | 68.5 |
| Mar-26 | 84.4 |
| Apr-26 | 80.4 |
Table A. Unadjusted Passenger Enplanements Compared to Previous Time Periods
| Unadjusted | Passengers | Percent Change Compared to | ||
Previous | Two Years | Three Years | ||
April | 80.4 | 0.0% | -1.1% | 3.6% |
Seasonally adjusted trends in U.S. airlines passenger enplanements
April seasonally adjusted
- Systemwide enplanements (80.5M) were down 3.3% from the all-time high of 83.3 million reached in June 2024.
- Domestic enplanements (70.0M) were down 3.3% from the all-time high of 72.3 million reached in June 2024.
- International enplanements (10.57M) were down 4.8% from the all-time high of 11.1 million reached in December 2024.
Table B. Seasonally Adjusted Passenger Enplanements Compared to Previous Time Periods
| Seasonally Adjusted | Passengers | Percent Change Compared to | ||
Previous | Previous | Three Years | ||
April | 80.5 | -1.2% | 0.1% | 3.2% |
For data filed through April, see accompanying tables. For the complete database of reported data, see Traffic. For an explanation of BTS’ seasonal adjustment methodology, see Seasonal Adjustment.
Reporting Notes
Data are compiled from monthly reports filed with BTS by commercial U.S. air carriers detailing operations, passenger traffic and freight traffic. This release includes data received by BTS from 77 U.S. carriers as of July 7 for U.S. carrier scheduled civilian operations.
See the BTS Airlines and Airports page for additional scheduled service numbers through April for U.S. airlines. International data by origin and destination is available through January. International totals in this press release consist of all U.S. carrier operations to and from the U.S. and from one foreign point to another foreign point. BTS’ Airlines and Airports page does not include U.S. carriers’ foreign point-to-point flights.
BTS has scheduled August 13, 2026 for the release of data through May.
None of the data is from samples. Measures of statistical significance do not apply to the complete air traffic data.
BTS separately releases preliminary enplanement estimates. Unlike the monthly air traffic releases, which are calculated from U.S. carrier scheduled civilian operations, the preliminary estimates are forecasted from data including all carriers and unscheduled service, with a total estimate of 91.4M passengers for April 2026. Using only the U.S. carrier scheduled service figures, BTS’ preliminary estimates for April 2026 were 81.2M passengers, which was over 98% accurate.
Missing Carriers: (X4) Air Excursions LLC, (J5) Kalinin Aviation LLC d/b/a Alaska Seaplanes, (GV)
Grant Aviation, (I4) Scott Air LLC dba Island Air Express, (V8) Iliamna Air Taxi and (WRD) Ward
Air
To receive updates from BTS directly to your email, please consider subscribing to our GovDelivery service.