


Monthly Passengers on U.S. Scheduled Airlines (Domestic + International), April 2023 - April 2026
Figure
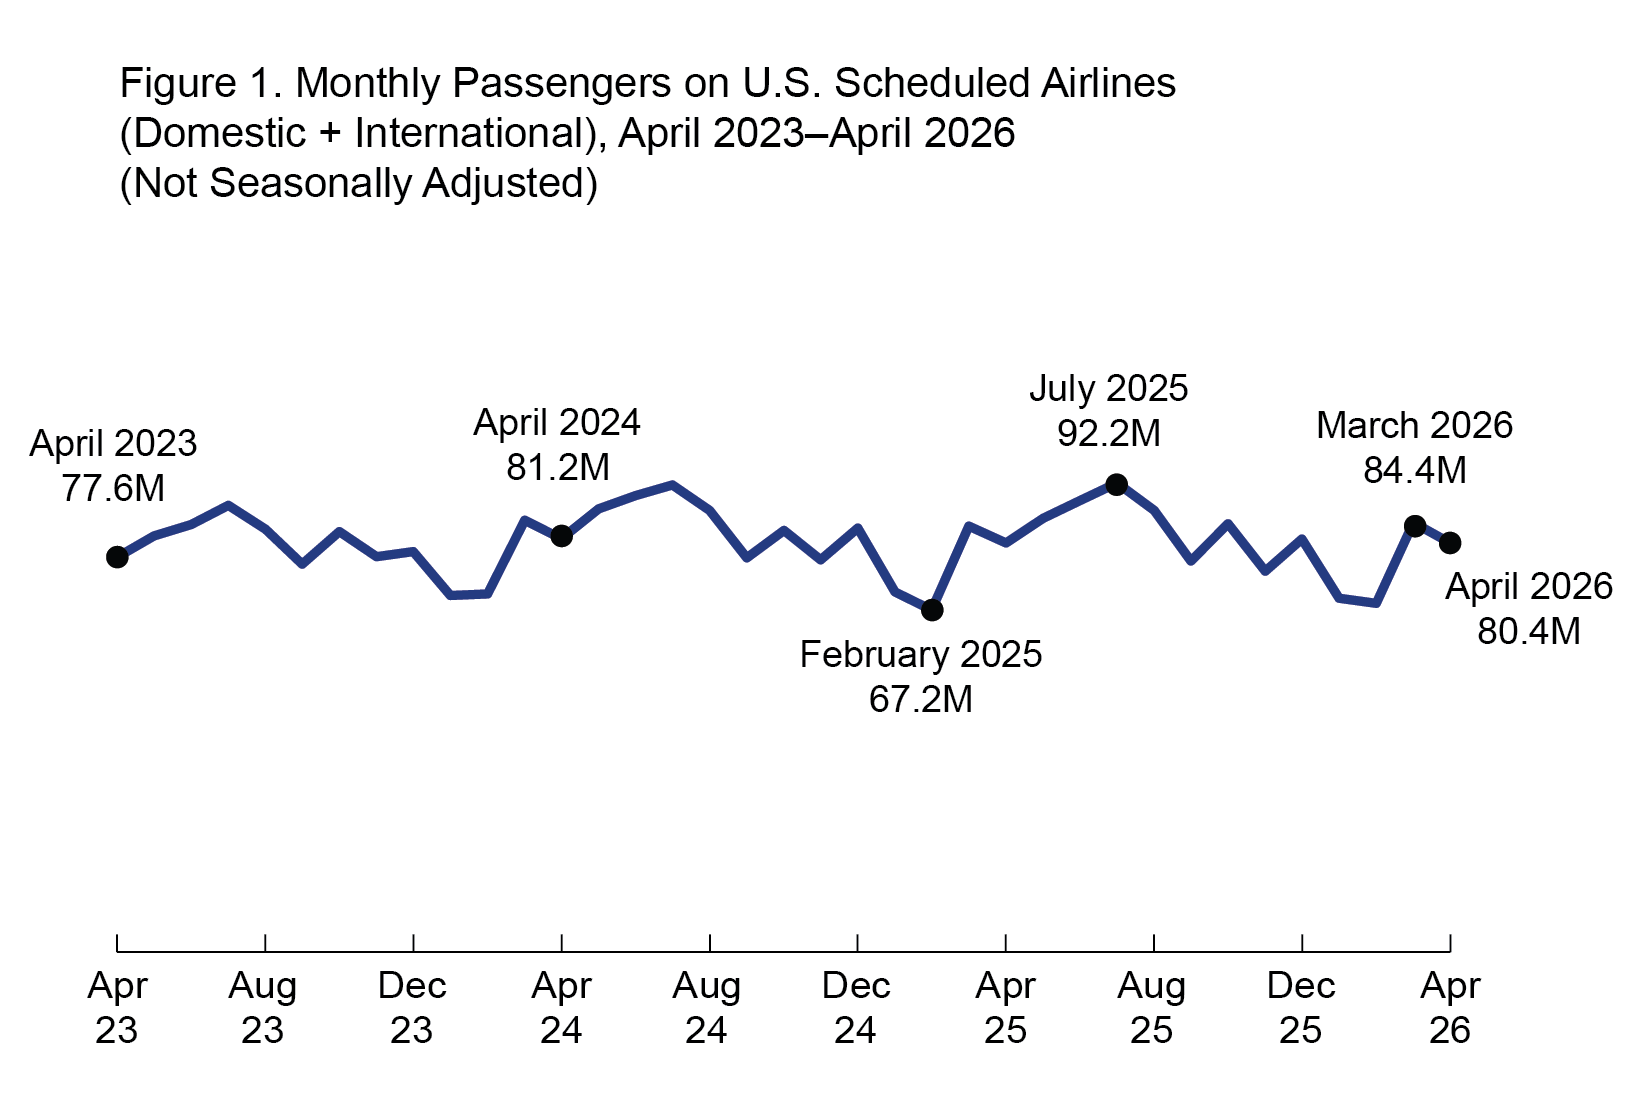
Dataset Table:
| Month | Domestic + International passengers |
|---|---|
| Apr-23 | 77.6 |
| May-23 | 81.8 |
| Jun-23 | 84.0 |
| Jul-23 | 87.8 |
| Aug-23 | 83.1 |
| Sep-23 | 76.3 |
| Oct-23 | 82.6 |
| Nov-23 | 77.7 |
| Dec-23 | 78.7 |
| Jan-24 | 70.1 |
| Feb-24 | 70.4 |
| Mar-24 | 84.9 |
| Apr-24 | 81.2 |
| May-24 | 87.1 |
| Jun-24 | 89.7 |
| Jul-24 | 91.8 |
| Aug-24 | 86.8 |
| Sep-24 | 77.5 |
| Oct-24 | 82.8 |
| Nov-24 | 77.1 |
| Dec-24 | 83.3 |
| Jan-25 | 70.7 |
| Feb-25 | 67.2 |
| Mar-25 | 83.7 |
| Apr-25 | 80.4 |
| May-25 | 85.3 |
| Jun-25 | 88.7 |
| Jul-25 | 92.2 |
| Aug-25 | 86.8 |
| Sep-25 | 76.8 |
| Oct-25 | 84.2 |
| Nov-25 | 74.8 |
| Dec-25 | 81.2 |
| Jan-26 | 69.5 |
| Feb-26 | 68.5 |
| Mar-26 | 84.4 |
| Apr-26 | 80.4 |