
August 2018 U.S. Passenger Airline Employment Data
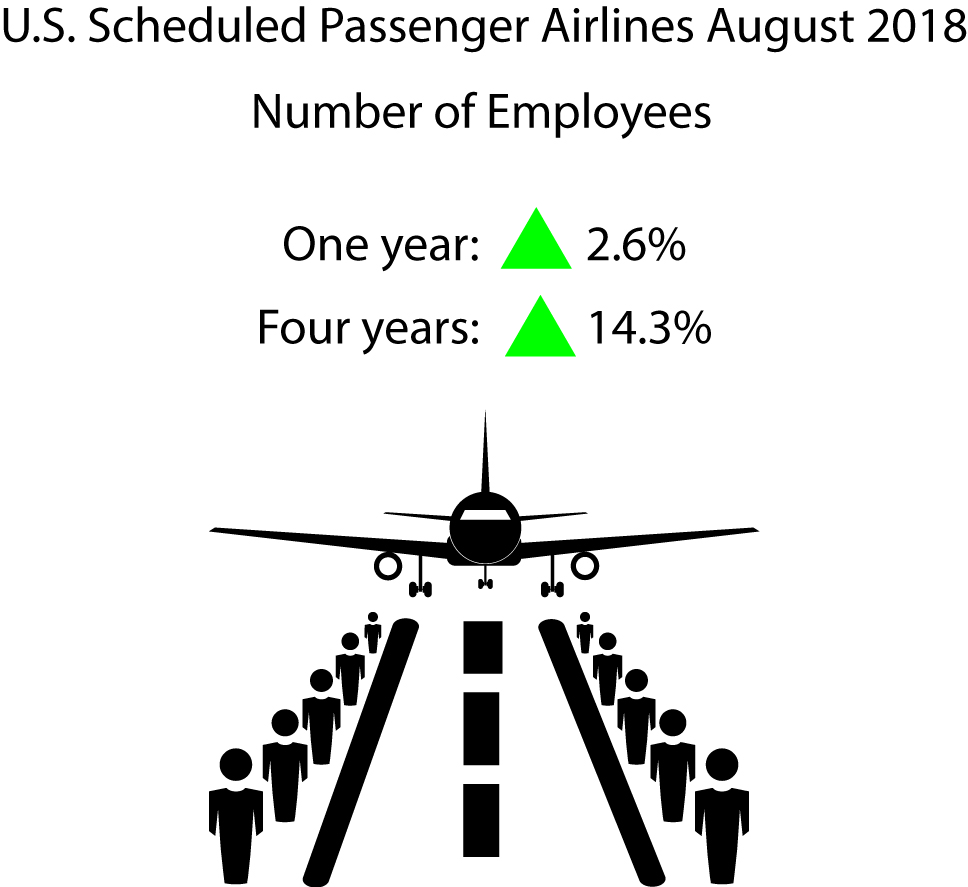
U.S. scheduled passenger airlines employed 2.6 percent more workers in August 2018 than in August 2017:
- August’s 439,615 full-time equivalents (FTE), was the second highest monthly employment total since November 2004 (439,776 FTEs), down 0.9 percent from the highest monthly total in July 2018 (443,475).
- August was the 58th consecutive month that U.S. scheduled passenger airline FTEs exceeded the same month of the previous year.
Scheduled Passenger Airline Full-Time Equivalent Employees, Month of August, 1990-2018
| August FTEs in thousands (000) | 1 | |
|---|---|---|
| 1990 | 465.9 | 2 |
| 1991 | 449.2 | 3 |
| 1992 | 453.4 | 4 |
| 1993 | 446.1 | 5 |
| 1994 | 432.6 | 6 |
| 1995 | 432.3 | 7 |
| 1996 | 438.3 | 8 |
| 1997 | 455.9 | 9 |
| 1998 | 470.8 | 10 |
| 1999 | 503.1 | 11 |
| 2000 | 524.7 | 12 |
| 2001 | 534.1 | 13 |
| 2002 | 472.2 | 14 |
| 2003 | 433.5 | 15 |
| 2004 | 443.4 | 16 |
| 2005 | 416.9 | 17 |
| 2006 | 404.1 | 18 |
| 2007 | 415.2 | 19 |
| 2008 | 406.5 | 20 |
| 2009 | 384.3 | 21 |
| 2010 | 378.4 | 22 |
| 2011 | 387.0 | 23 |
| 2012 | 386.9 | 24 |
| 2013 | 380.5 | 25 |
| 2014 | 384.5 | 26 |
| 2015 | 397.0 | 27 |
| 2016 | 414.2 | 28 |
| 2017 | 428.5 | 29 |
| 2018 | 439.6 | 30 |
| 31 |
FTE calculations count two part-time employees as one full-time employee.
Bureau of Transportation Statistics
All 21 scheduled service passenger airlines
- 439,615 FTEs
- Up 2.6 percent (11,160 FTEs) over August 2017 (428,455 FTEs)
- Up 14.3 percent (55,137 FTEs) over August 2014 (384,478 FTEs)
Four network airlines
- 285,145 FTEs, 64.9 percent of total scheduled passenger airline FTEs
- Up 2.5 percent (6,987 FTEs) over August 2017 (278,158 FTEs)
- Up 11.3 percent (29,050 FTEs) over August 2014 (256,095 FTEs)
Network airlines operate a significant portion of their flights using at least one hub where connections are made for flights to down-line destinations or spoke cities. Note that beginning with January 2018 data, Virgin America’s FTE numbers are included with Alaska Airlines in the network category. They were previously listed in the low-cost category.
Five low-cost airlines
- 91,703 FTEs, 20.9 percent of total scheduled passenger airline FTEs
- Up 2.2 percent (1,985 FTEs) over August 2017 (89,718 FTEs)
- Up 28.5 percent (20,316 FTEs) over August 2014 (71,387 FTEs)
Low-cost airlines operate under a low-cost business model, with infrastructure and aircraft operating costs below the overall industry average.
10 regional airlines
- 54,789 FTEs, 12.5 percent of total scheduled passenger airline FTEs
- Up 4.1 percent (2,174 FTEs) over August 2017 (52,615 FTEs)
- Up 8.1 percent (4,118 FTEs) over August 2014 (50,671 FTEs)
Regional carriers typically provide service from small cities, using primarily regional jets to support the network carriers’ hub and spoke systems.
Top Employers by Group
- Network: American 102,261 FTEs
- Low-cost: Southwest 58,135 FTEs
- Regional: SkyWest 14,142 FTEs
Two other airlines
Other carriers generally operate within specific niche markets. They are: Hawaiian Airlines and Sun Country Airlines.
Reporting Notes
Airlines that operate at least one aircraft that has more than 60 seats or the capacity to carry a payload of passengers, cargo and fuel weighing more than 18,000 pounds must report monthly employment statistics.
Data are compiled from monthly reports filed with BTS by commercial air carriers as of Oct. 9. Additional airline employment data and previous releases can be found on the BTS website. BTS has scheduled release of September passenger airline employment data for Nov. 19.