


August 2026 U.S. Transportation Sector Unemployment (4.7%) Falls Below the August 2025 Level (5.9%)
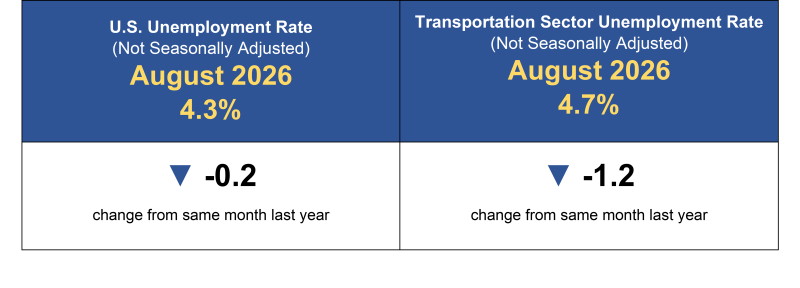
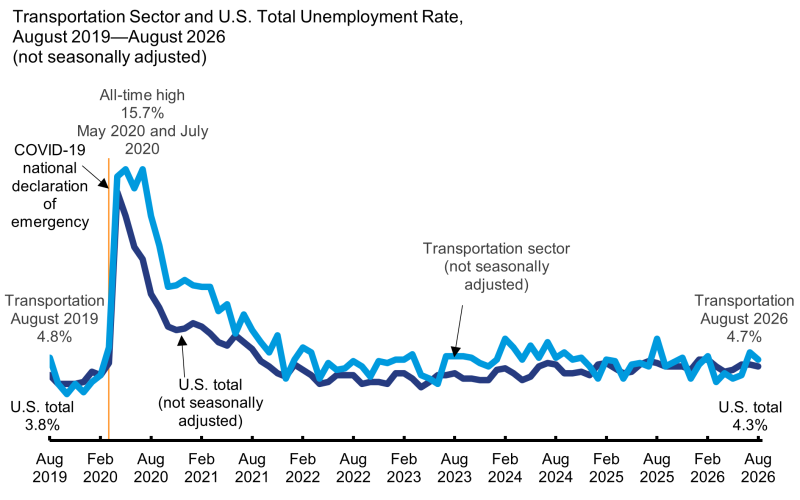
The unemployment rate in the U.S. transportation sector was 4.7% (not seasonally adjusted) in August 2026 according to Bureau of Labor Statistics (BLS). These data have been updated on the Bureau of Transportation Statistics’ (BTS) Unemployment in Transportation dashboard. In August 2026, the transportation sector unemployment rate fell 1.2 percentage points from 5.9% in August 2025. Unemployment in the transportation sector reached its highest level during the COVID-19 pandemic (15.7%) in May 2020 and July 2020.
Unemployment in the transportation sector was higher than overall unemployment. BLS reports that the U.S. unemployment rate, not seasonally adjusted, in August 2026 was 4.3% or 0.4 percentage points below the transportation sector rate. Seasonally adjusted, the U.S. unemployment rate in August 2026 was 4.1%.
NOTE: BLS did not release household survey estimates for October 2025.
Seasonally adjusted, employment in the transportation and warehousing sector rose to 6,606,300 in August 2026 — up 0.1% from the previous month but down 0.8% from August 2025. By mode (seasonally adjusted):
- Air transportation fell to 566,100 in August 2026 — down 0.3% from the previous month and down 0.9% from August 2025.
- Truck transportation rose to 1,470,300 in August 2026 — up 0.3% from the previous month but down 0.7% from August 2025.
- Transit and ground passenger transportation rose to 496,900 in August 2026 — up 0.8% from the previous month and up 1.3% from August 2025.
- Rail transportation rose to 150,400 in August 2026 — up 0.6% from the previous month but down 2.4% from August 2025.
- Water transportation rose to 70,600 in August 2026 — up 0.4% from the previous month but down 1.3% from August 2025.
- Pipeline transportation fell to 56,900 in August 2026 — down 0.4% from the previous month but remained unchanged from August 2025.
- Warehousing and storage fell to 1,837,400 in August 2026 — down 0.1% from the previous month and down 1.7% from August 2025.
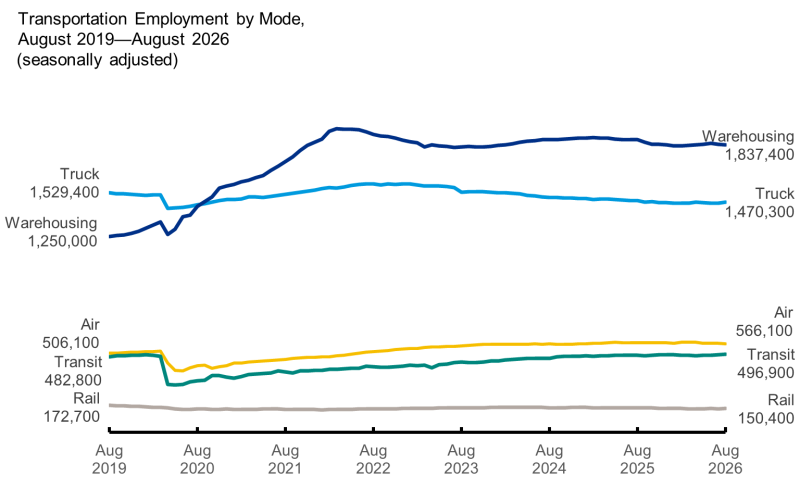
NOTES: August 2019 and August 2026 employment (seasonally adjusted) not shown for water (66,500 and 70,600, respectively) or pipeline (51,800 and 56,900, respectively) transportation. All-time highs (seasonally adjusted) with records beginning in 1990: air March 2001 (633,600); pipeline July 1991 (61,200); rail January 1990 (278,100); transit June 2019 (503,900); truck October 2022 (1,588,600); warehousing and storage March 2022 (1,939,300); and water January 2026 (72,400)
Charts updated this month by section include:
Unemployment in the Transportation and Warehousing Sector and in Transportation and Material Moving Occupations
Monthly Employment in the Transportation and Warehousing Sector, Establishment Data
- Monthly Employment in the Transportation and Warehousing Sector
- Monthly Employment in the Transportation and Warehousing Sector by Mode
Visit Transportation Economic Trends for more topics.
The unemployment rate is the total number of unemployed persons, expressed as a percentage of the civilian labor force. The civilian labor force includes all persons aged 16 and older who are employed and unemployed; meaning they are either currently working or actively looking for work. Unemployed persons include those who actively sought a job within the last four weeks. People waiting to start a new job who have not actively sought a job in the last four weeks are not counted as employed or unemployed; they are considered to be out of the labor force.
An unemployed person’s industry is the industry for the last job they held in the workforce, which may or may not reflect their current job search field or industry.