
Border Crossing Data Release: October 2025
BTS 2026-02
This release is published on a fixed schedule as required by the Office of Management and Budget, and statistics in this release may be revised when inputs to the statistics are corrected or updated. Data on the program page of this website are the most up-to-date and complete.
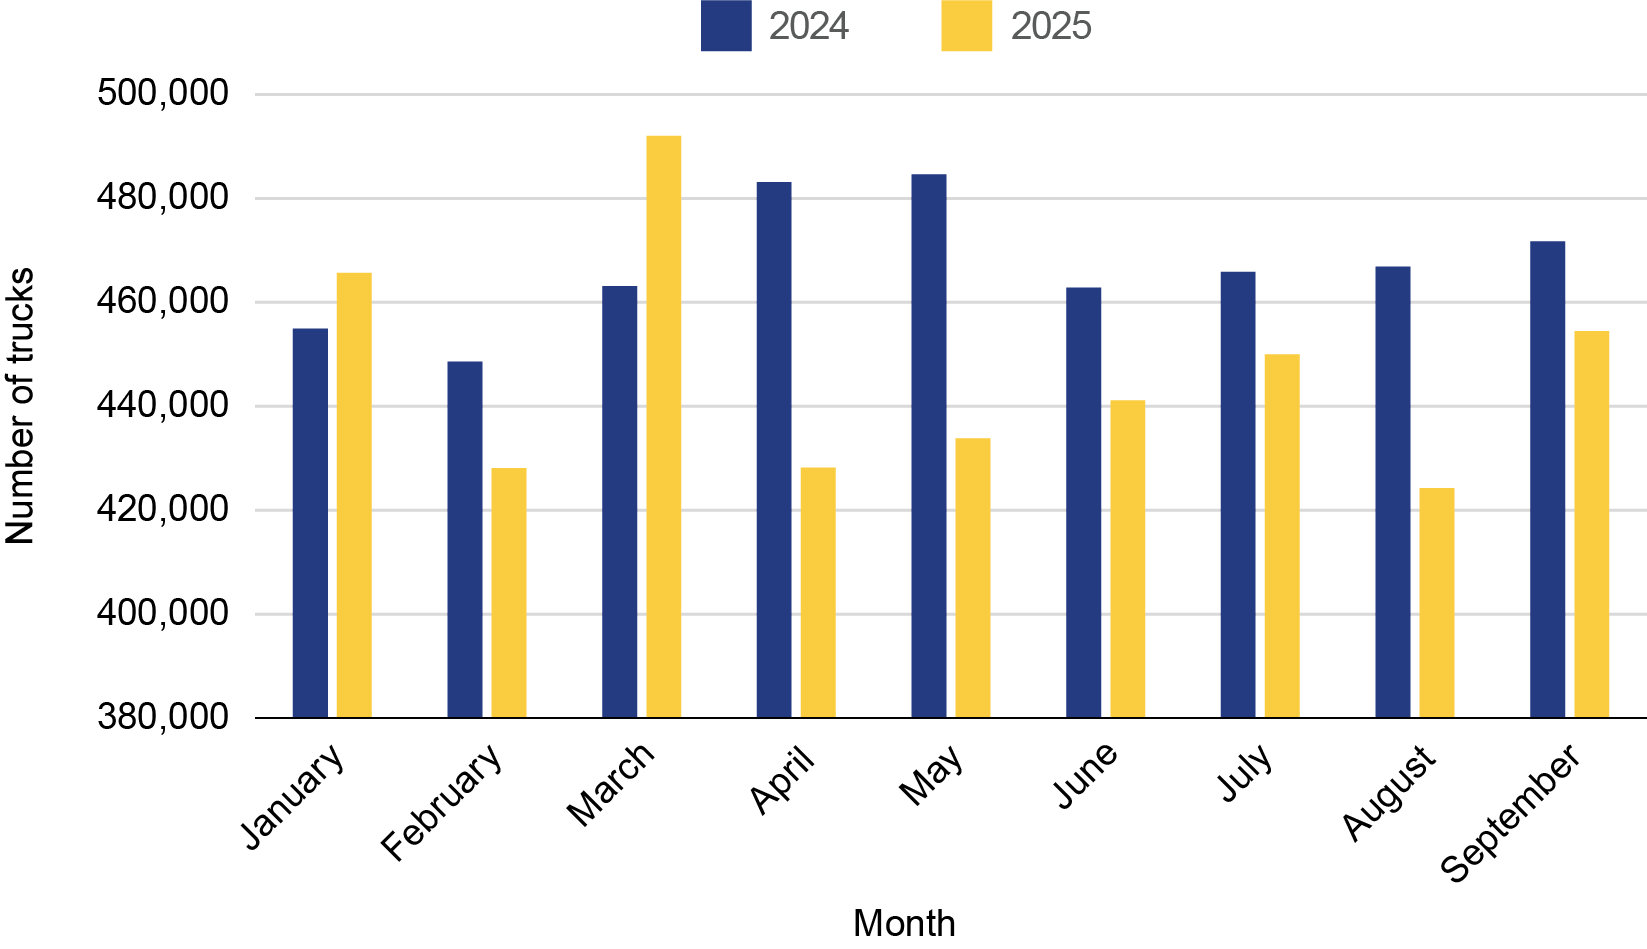
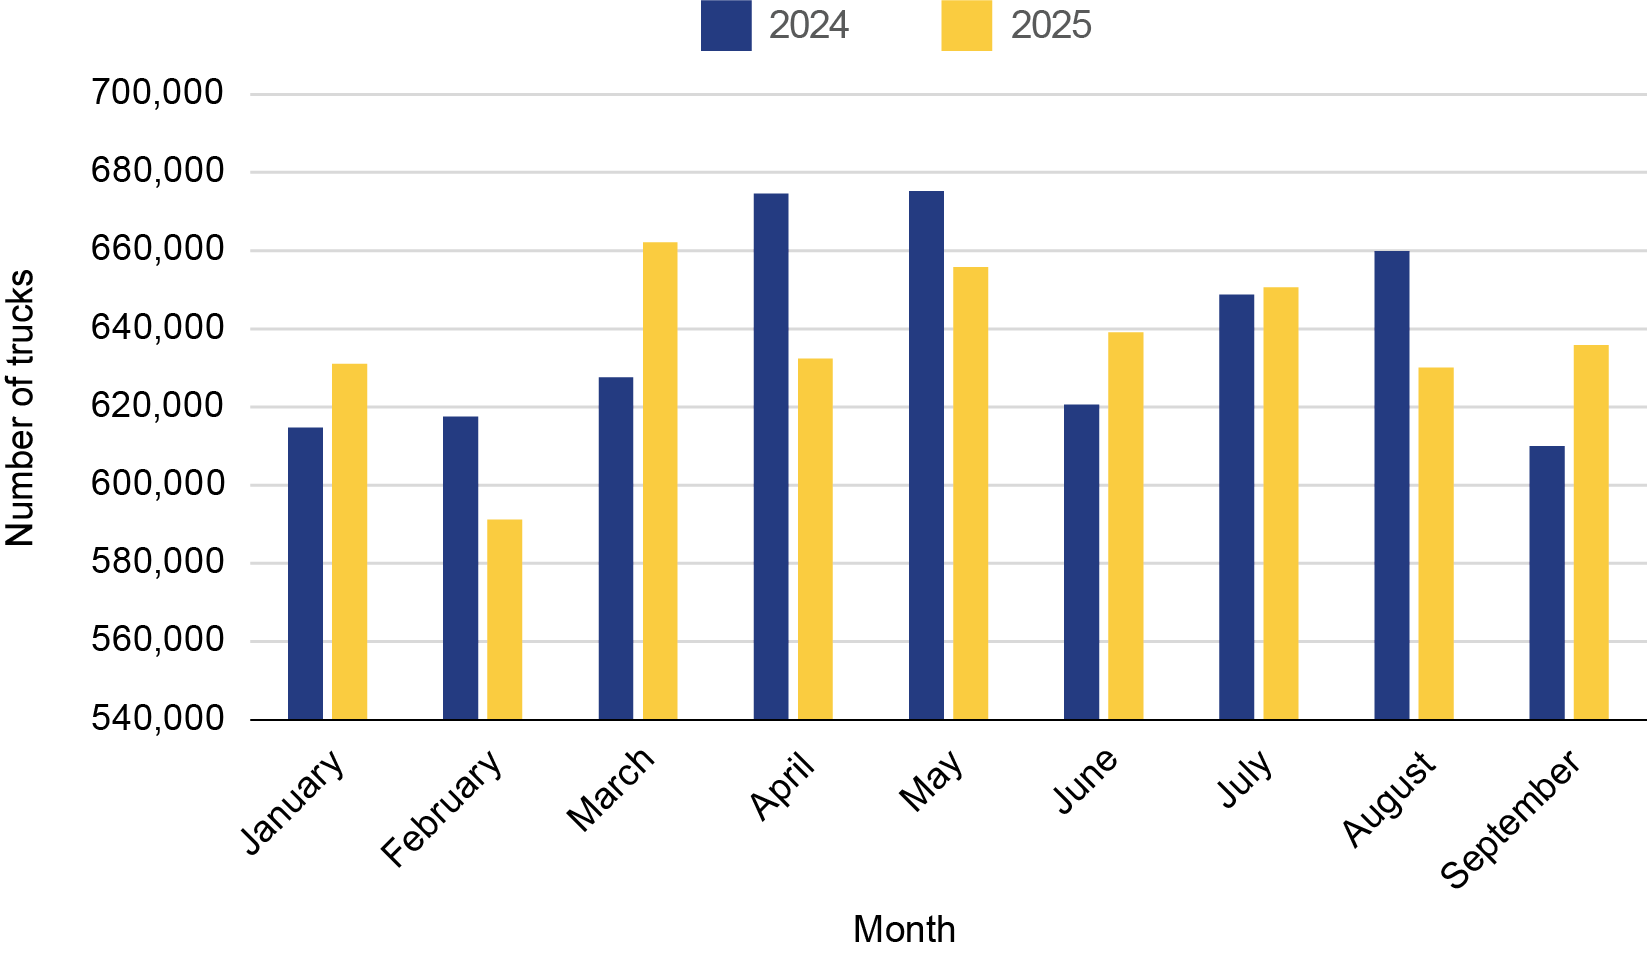
The Bureau of Transportation Statistics (BTS) has released Border Crossing data compiled for the month of October 2025. Coverage includes trucks, buses, personal vehicles, and pedestrians entering the U.S. by land from Canada and Mexico. In October 2025, the number of trucks entering the U.S. from Canada was 459,169, a 7.3% decrease from October 2024. On the southern border, 687,577 trucks entered the U.S. from Mexico in October 2025, a 1.4% increase from October 2024.
For full coverage of this data, please visit the border crossing data homepage at https://data.bts.gov/stories/s/jswi-2e7b.
Pedestrians, personal vehicles, and trucks from Canada and Mexico: 2024 - 2025
| US-Canada Border: 2024 | ||||||||||||
| Mode | January | February | March | April | May | June | July | August | September | October | November | December |
| Pedestrians | 11,942 | 7,841 | 9,293 | 17,569 | 26,286 | 30,011 | 42,598 | 37,612 | 30,887 | 25,002 | 14,929 | 13,442 |
| Personal Vehicles | 1,327,146 | 1,429,367 | 1,705,988 | 1,681,080 | 1,929,321 | 2,077,649 | 2,451,497 | 2,567,243 | 2,010,159 | 1,933,665 | 1,713,413 | 1,736,954 |
| Trucks | 454,945 | 448,552 | 463,124 | 483,095 | 484,650 | 462,841 | 465,863 | 466,822 | 471,767 | 495,318 | 443,947 | 409,626 |
| US-Mexico Border: 2024 | ||||||||||||
| Mode | January | February | March | April | May | June | July | August | September | October | November | December |
| Pedestrians | 2,066,161 | 3,262,356 | 3,504,341 | 3,433,373 | 3,516,787 | 3,218,138 | 3,513,982 | 3,344,494 | 3,626,960 | 3,577,250 | 3,652,694 | 4,052,528 |
| Personal Vehicles | 6,240,458 | 5,966,836 | 6,451,296 | 6,390,407 | 6,547,709 | 6,292,280 | 6,395,969 | 6,521,647 | 6,340,289 | 6,676,183 | 6,393,391 | 6,668,101 |
| Trucks | 614,698 | 617,554 | 627,527 | 674,560 | 675,205 | 620,670 | 648,729 | 659,827 | 610,016 | 677,862 | 618,029 | 572,530 |
| US-Canada Border: 2025 | ||||||||||||
| Mode | January | February | March | April | May | June | July | August | September | October | November | December |
| Pedestrians | 9,361 | 7,927 | 9,194 | 12,559 | 15,377 | 17,767 | 46,131 | 60,541 | 38,745 | 42,077 | ||
| Personal Vehicles | 1,441,053 | 1,219,057 | 1,347,969 | 1,255,799 | 1,449,550 | 1,639,816 | 1,942,644 | 2,056,078 | 1,618,590 | 1,590,327 | ||
| Trucks | 465,709 | 428,116 | 491,971 | 428,253 | 433,897 | 441,096 | 450,024 | 424,246 | 454,488 | 459,169 | ||
| US-Mexico Border: 2025 | ||||||||||||
| Mode | January | February | March | April | May | June | July | August | September | October | November | December |
| Pedestrians | 3,475,810 | 3,131,874 | 3,252,714 | 3,620,128 | 3,638,472 | 2,941,285 | 3,541,346 | 3,442,485 | 3,405,970 | 3,522,988 | ||
| Personal Vehicles | 6,344,347 | 5,751,534 | 6,331,480 | 6,271,583 | 6,458,158 | 6,192,410 | 6,339,403 | 6,501,258 | 6,326,722 | 6,578,256 | ||
| Trucks | 631,090 | 591,249 | 662,135 | 632,437 | 655,829 | 639,126 | 650,521 | 630,099 | 635,915 | 687,577 | ||
| Source: Bureau of Transportation Statistics, Border Crossing Data, available at https://data.bts.gov/stories/s/jswi-2e7b | ||||||||||||
U.S-Canada Border: Trucks
U.S-Mexico Border: Trucks
The BTS Border Crossing Data provide summary statistics for inbound crossings at the U.S.-Canada and the U.S.-Mexico border at the port level. Data are available for trucks, trains, containers, buses, personal vehicles, passengers, and pedestrians. Border crossing data are collected at ports of entry by U.S. Customs and Border Protection (CBP). The data reflect the number of vehicles, containers, passengers, and pedestrians entering the United States through CBP facilities. CBP does not collect comparable data on outbound crossings. BTS also does not collect data about the size or number of seats per bus. Users seeking more detailed data such as outbound counts may therefore want to review information from individual bridge operators, border state governments, or the Mexican and Canadian governments.
Additional Tools Available:
- Full Border Crossing Database
- Frequently Asked Questions
- Coverage, Availability, Definitions, and Notes
- CBP Port Locator Tool
- Border Wait Time Data
- CPB Title 8 Apprehensions, Title 8 Inadmissibles, and Title 42 Expulsions
- CBP Public Data Portal
To receive updates from BTS directly to your email, please consider subscribing to our GovDelivery service.