
Commercial Aviation Passengers Potentially Affected by Planned Reductions in Air Traffic
Today, the U.S. Department of Transportation (DOT) announced that, beginning tomorrow, there will be a 10% reduction of air traffic at 40 airports across the Nation as the lapse in appropriations continues. The Federal Aviation Administration released the list of first “core 30” impacted airports on their website.
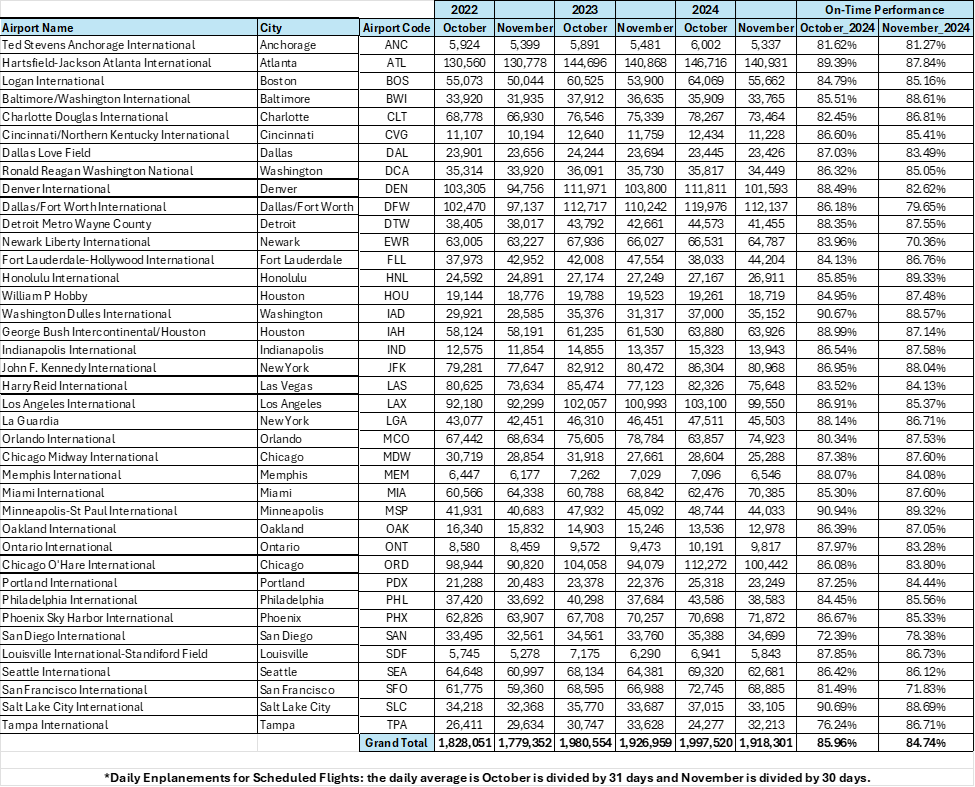
The Bureau of Transportation Statistics (BTS) estimates that more than 1.9 million daily passengers use the airports covered by the reduction in air traffic. The estimate is based on the monthly data for the number of passengers who boarded planes at the 40 airports in the table below for the months of October and November 2022-2024. The daily average for October is the monthly total divided by 31 days, and the daily average for November is the monthly total divided by 30 days.
Daily Enplanements for Scheduled Flights from October-November 2022-2024
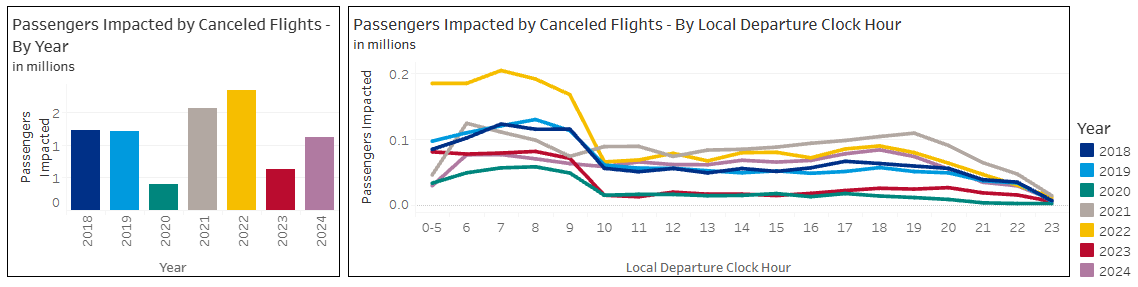
Passengers Impacted by Delayed and Canceled Flights

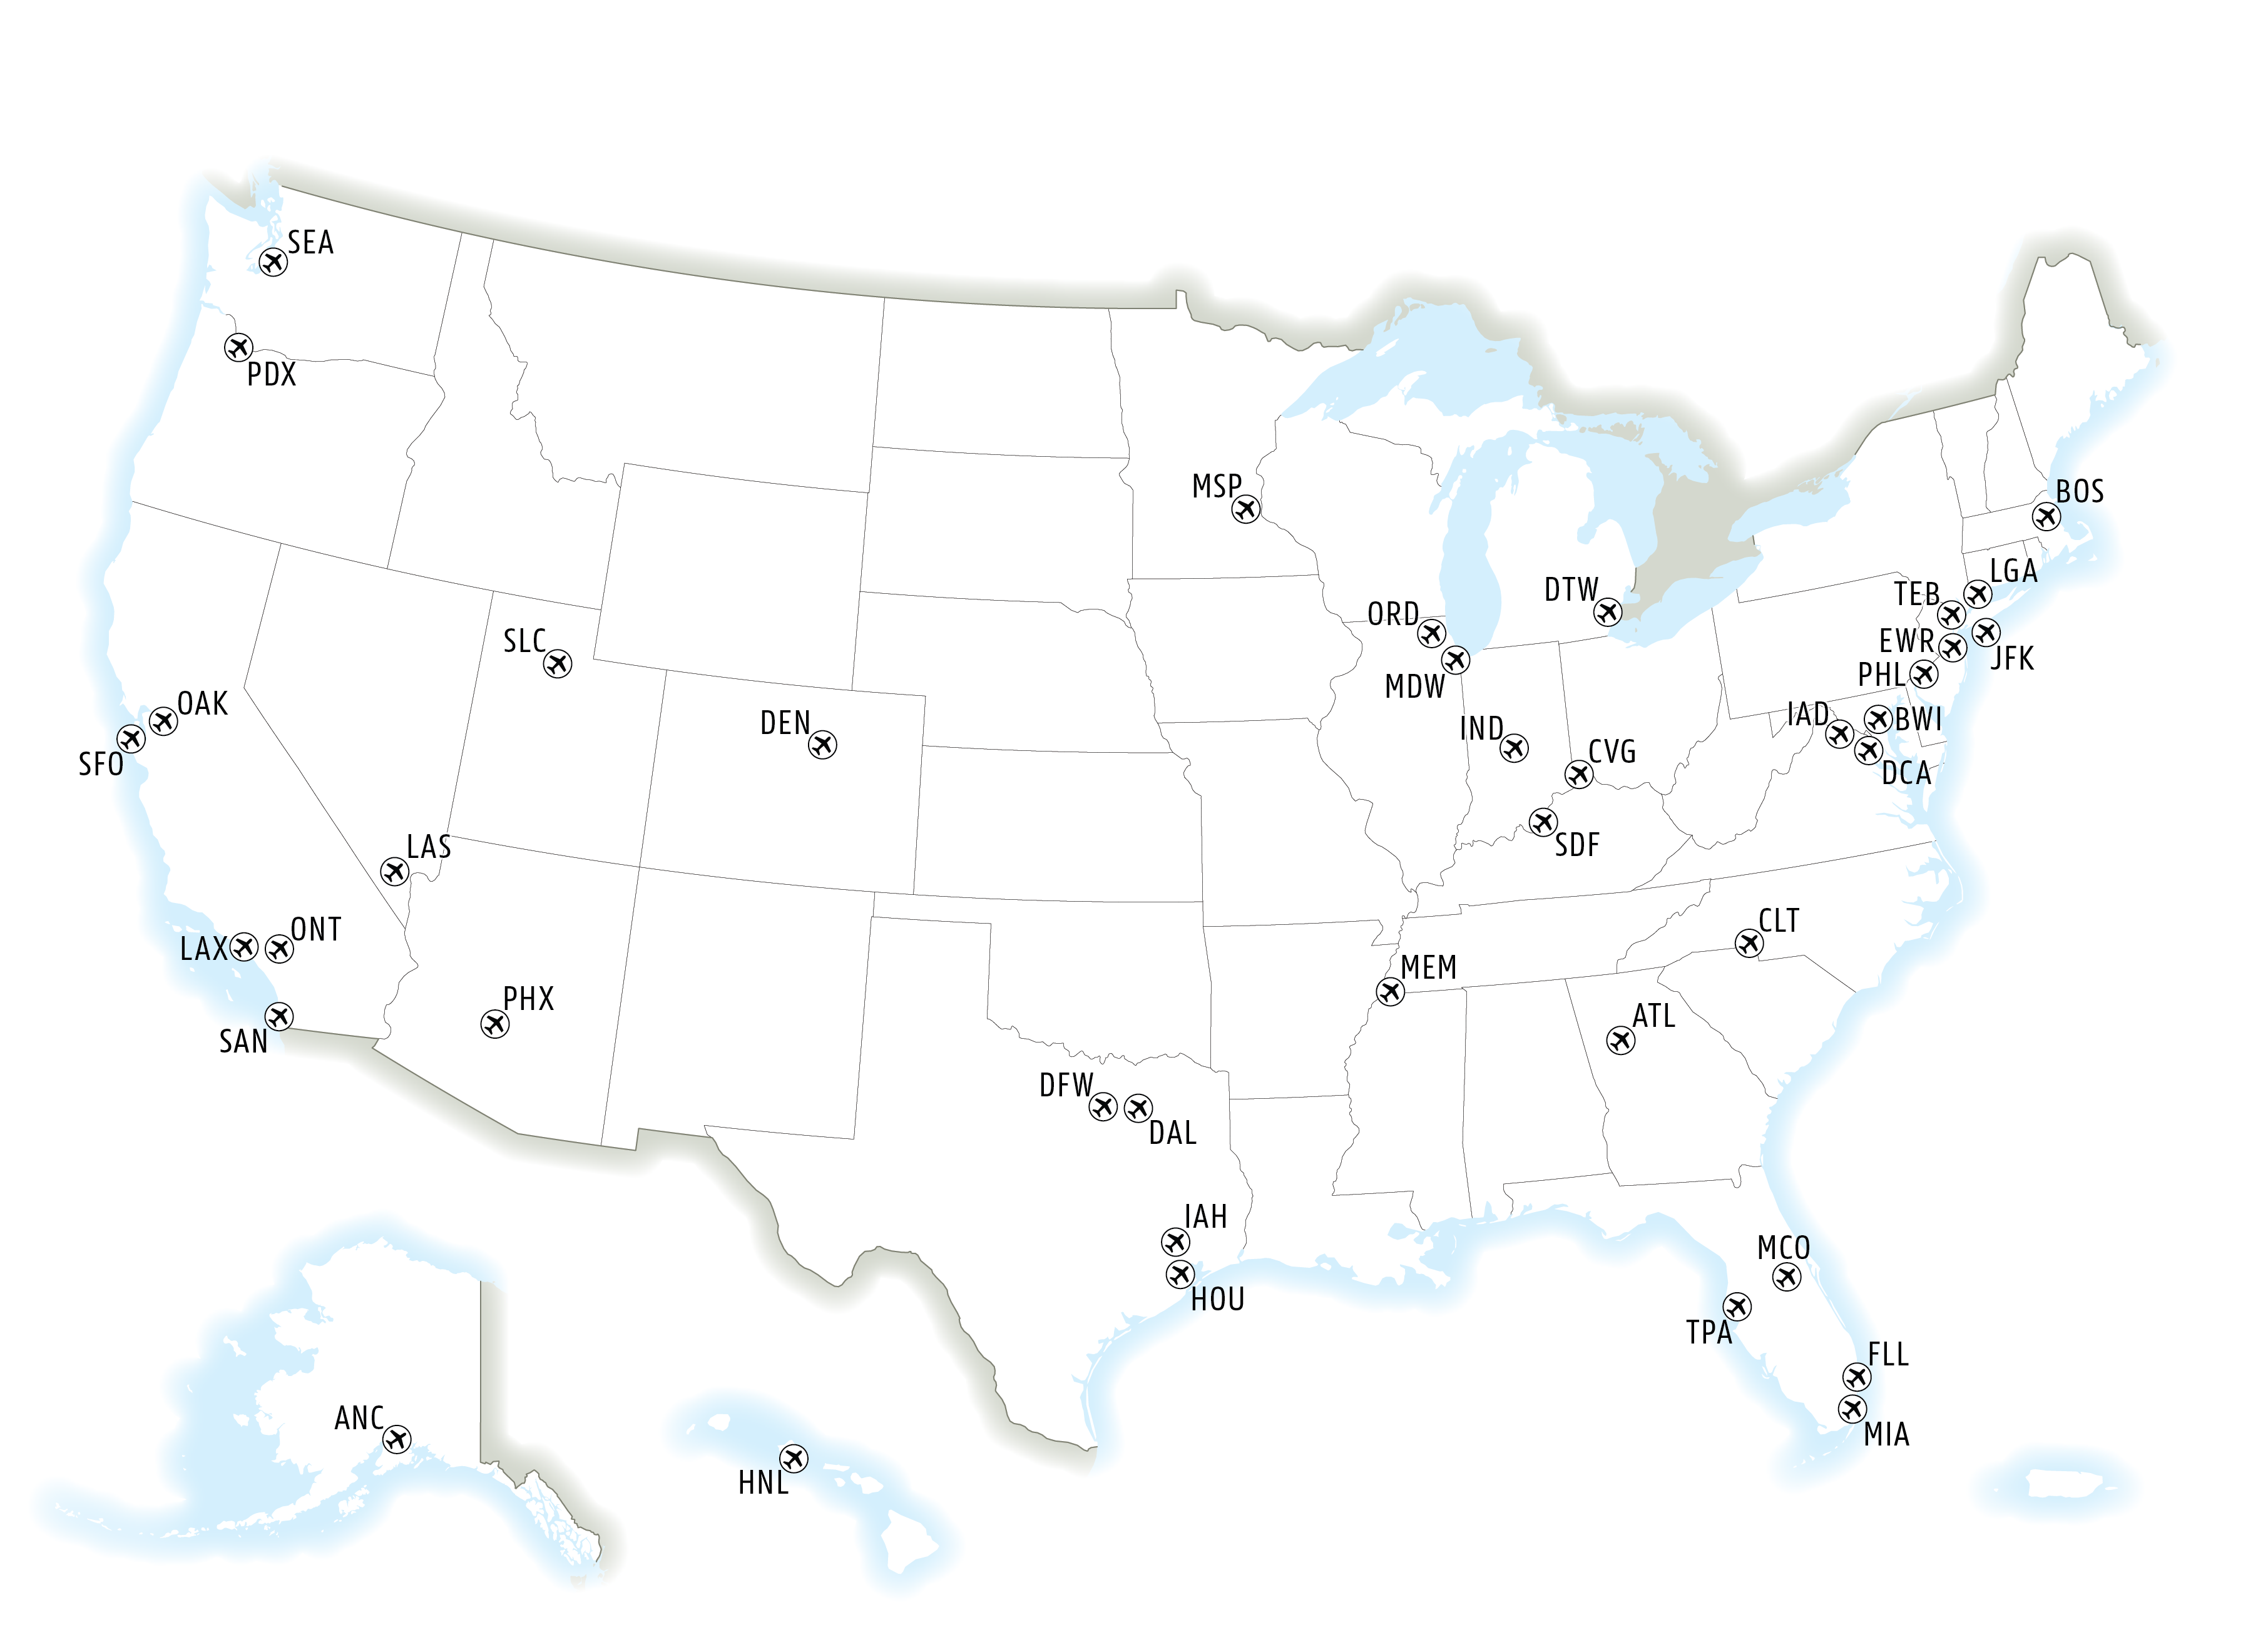
Map of the United States with Affected Airports
BTS is evaluating different methods to produce web-based projection tools for all users. Please visit the BTS website to use the daily airport enplanement linear projection model to create airport-specific estimates.
Reporting Notes
Data are compiled from monthly reports filed with BTS by commercial U.S. air carriers detailing operations, passenger traffic, and freight traffic. This release includes data received by BTS from 77 U.S. carriers as of October 7 for U.S. carrier scheduled civilian operations.
See the BTS Airlines and Airports page for additional scheduled service numbers through July for U.S. airlines. International data by origin and destination is available through April. International totals in this press release consist of all U.S. carrier operations to and from the U.S. and from one foreign point to another foreign point. BTS’ Airlines and Airports page does not include U.S. carriers’ foreign point-to-point flights.
BTS has scheduled November 13 for the release of data through August.
None of the data are from samples. Measures of statistical significance do not apply to the complete air traffic data.
BTS separately releases preliminary enplanement estimates. Unlike the monthly air traffic releases, which are calculated from U.S. carrier scheduled civilian operations, the preliminary estimates are forecasted from data including all carriers and unscheduled service, with a total estimate of 105.4M passengers for July. Using only the U.S. carrier scheduled service figures, BTS’ preliminary estimates for July were 93.3M passengers, which was over 98% accurate.
To receive updates from BTS directly to your email, please consider subscribing to our GovDelivery service.