Commodity Flow Survey 2022 Data Released
Every five years, the Bureau of Transportation Statistics (BTS) conducts the Commodity Flow Survey (CFS) as part of the U.S. Census Bureau’s economic census. This survey provides benchmark data that guide annual estimates of freight movement to, from, and within the United States.
CFS data provides a comprehensive, multimodal picture of national freight flows for roughly three-fourths of all freight movements and represents the only publicly available source of data for commodity flows by highway. CFS data are combined with other sources in the Freight Analysis Framework to create a complete picture of freight movements every 5 years that underlie annual estimates and forecasts of freight movements. The CFS provides additional shipment characteristics such as hazardous materials codes that are not in the Freight Analysis Framework. These estimates underpin understanding of supply chains, economic relationships among regions of the country, demands on the transportation system to serve the movement of goods, and investment needs for transportation infrastructure.
The 2022 CFS measured nearly 12.2 billion tons of goods valued at $18.0 trillion shipped by American manufacturers, wholesalers, and other selected industries according to the statistics released today. In its seventh edition since 1993, the 2022 CFS surveys approximately 165,000 establishments from the industries of mining, manufacturing, wholesale trade, auxiliaries (i.e. warehouses and distribution centers), and select retail and service trade industries that ship commodities. CFS data includes the type of commodities shipped, their origin and destination, their value and weight, and mode(s) of transport.
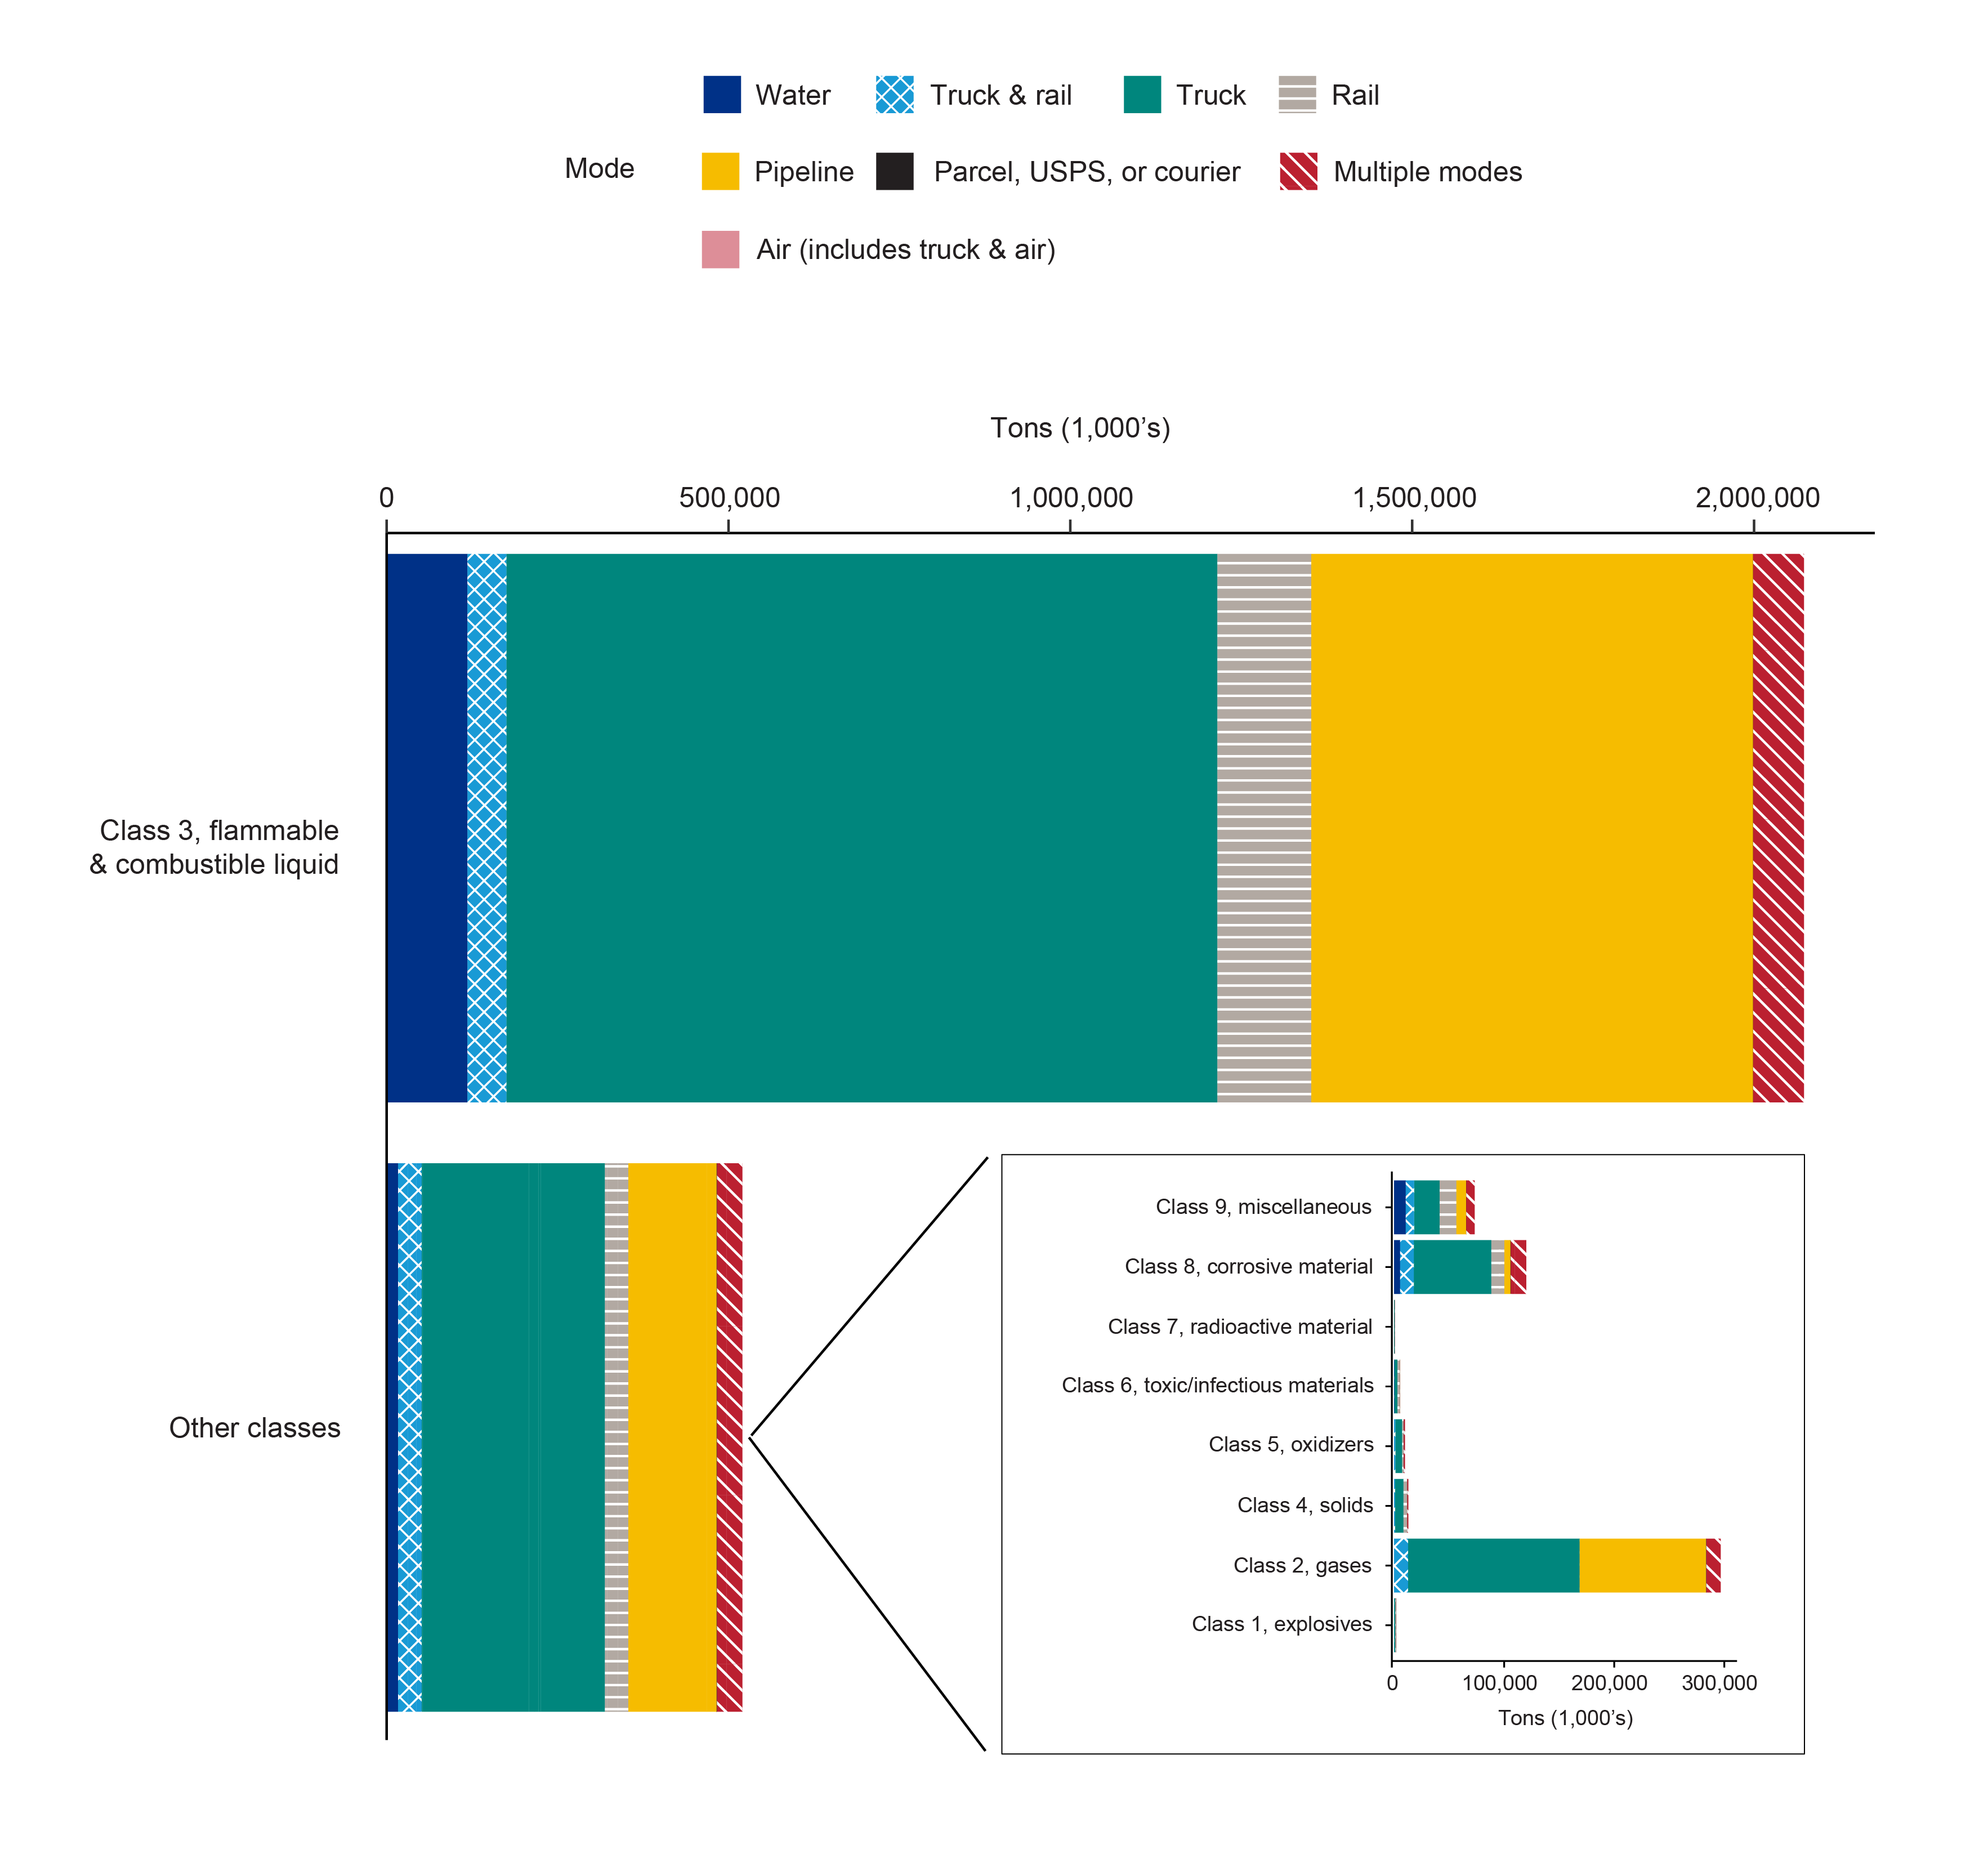
Figure 1: This shows the breakdown of transportation mode for the hazardous materials. Class 3 flammable liquids and Class 2 gases made up the vast majority of hazardous materials shipped and accounted for nearly all of the hazardous material shipped by pipeline.