


County-to-County Travel Time Database Expands to 2025
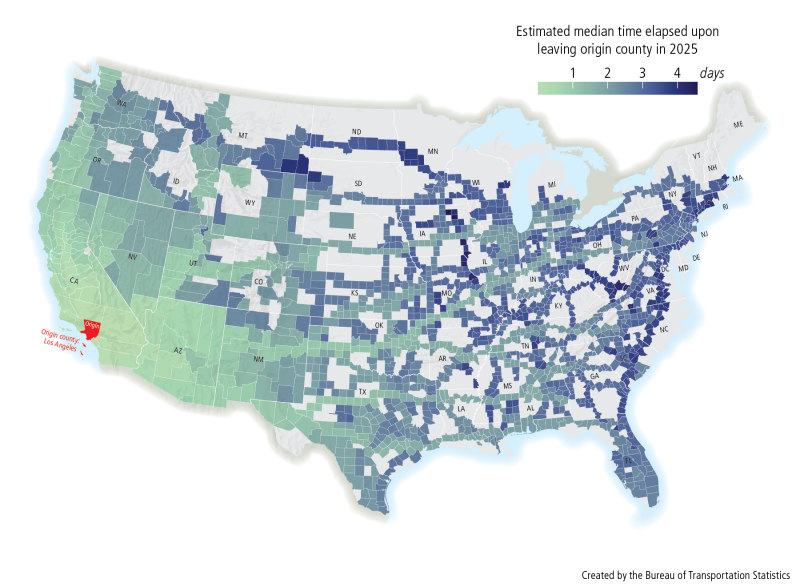
In August 2025, the Bureau of Transportation Statistics (BTS) launched the BTS Freight Mobility Initiative (FMI) County to County travel times database. This experimental product, which utilizes American Transportation Research Institute (ATRI) data, estimates the county-to-county travel times observed among the trucks in the BTS FMI database as they traveled throughout the continental United States. Within this dataset, users are provided with the median, twenty-fifth percentile, and seventy-fifth percentile travel times observed in the subset of trucks in the FMI database that were seen moving between each unique pairing of the more than 3,000 counties in the United States during each year of study. For contextualization, these estimates are accompanied by a binned count of the number of instances a truck was seen moving between each county pair. Altogether, these metrics provide users with a novel perspective on national-level, long-distance freight mobility.
Today, BTS added travel estimates for 2025 to this experimental dataset, the eighth year of data in this series that also includes 2018-2024.
BTS will use the rich location and temporal information contained in the BTS FMI database to prepare and release additional national-level statistics related to freight fluidity, calling attention to other trends and patterns observed in its continuous collection of processed Global Positioning System data. As new or updated products based on these data are prepared and finalized, BTS will share them with the public and solicit feedback on their usefulness for statistical analysis and research and to inform national transportation, planning, policy, and investments related to freight.
To receive updates from BTS directly to your email, please consider subscribing to our GovDelivery service.