
Docked Bikeshare Trips – March 2026
Today, the Bureau of Transportation Statistics (BTS) released docked bikeshare trips for March 2026.
From March 2025 to March 2026, docked bikeshare trips starting and ending at a docking station declined 2.9% on nine of the largest systems.
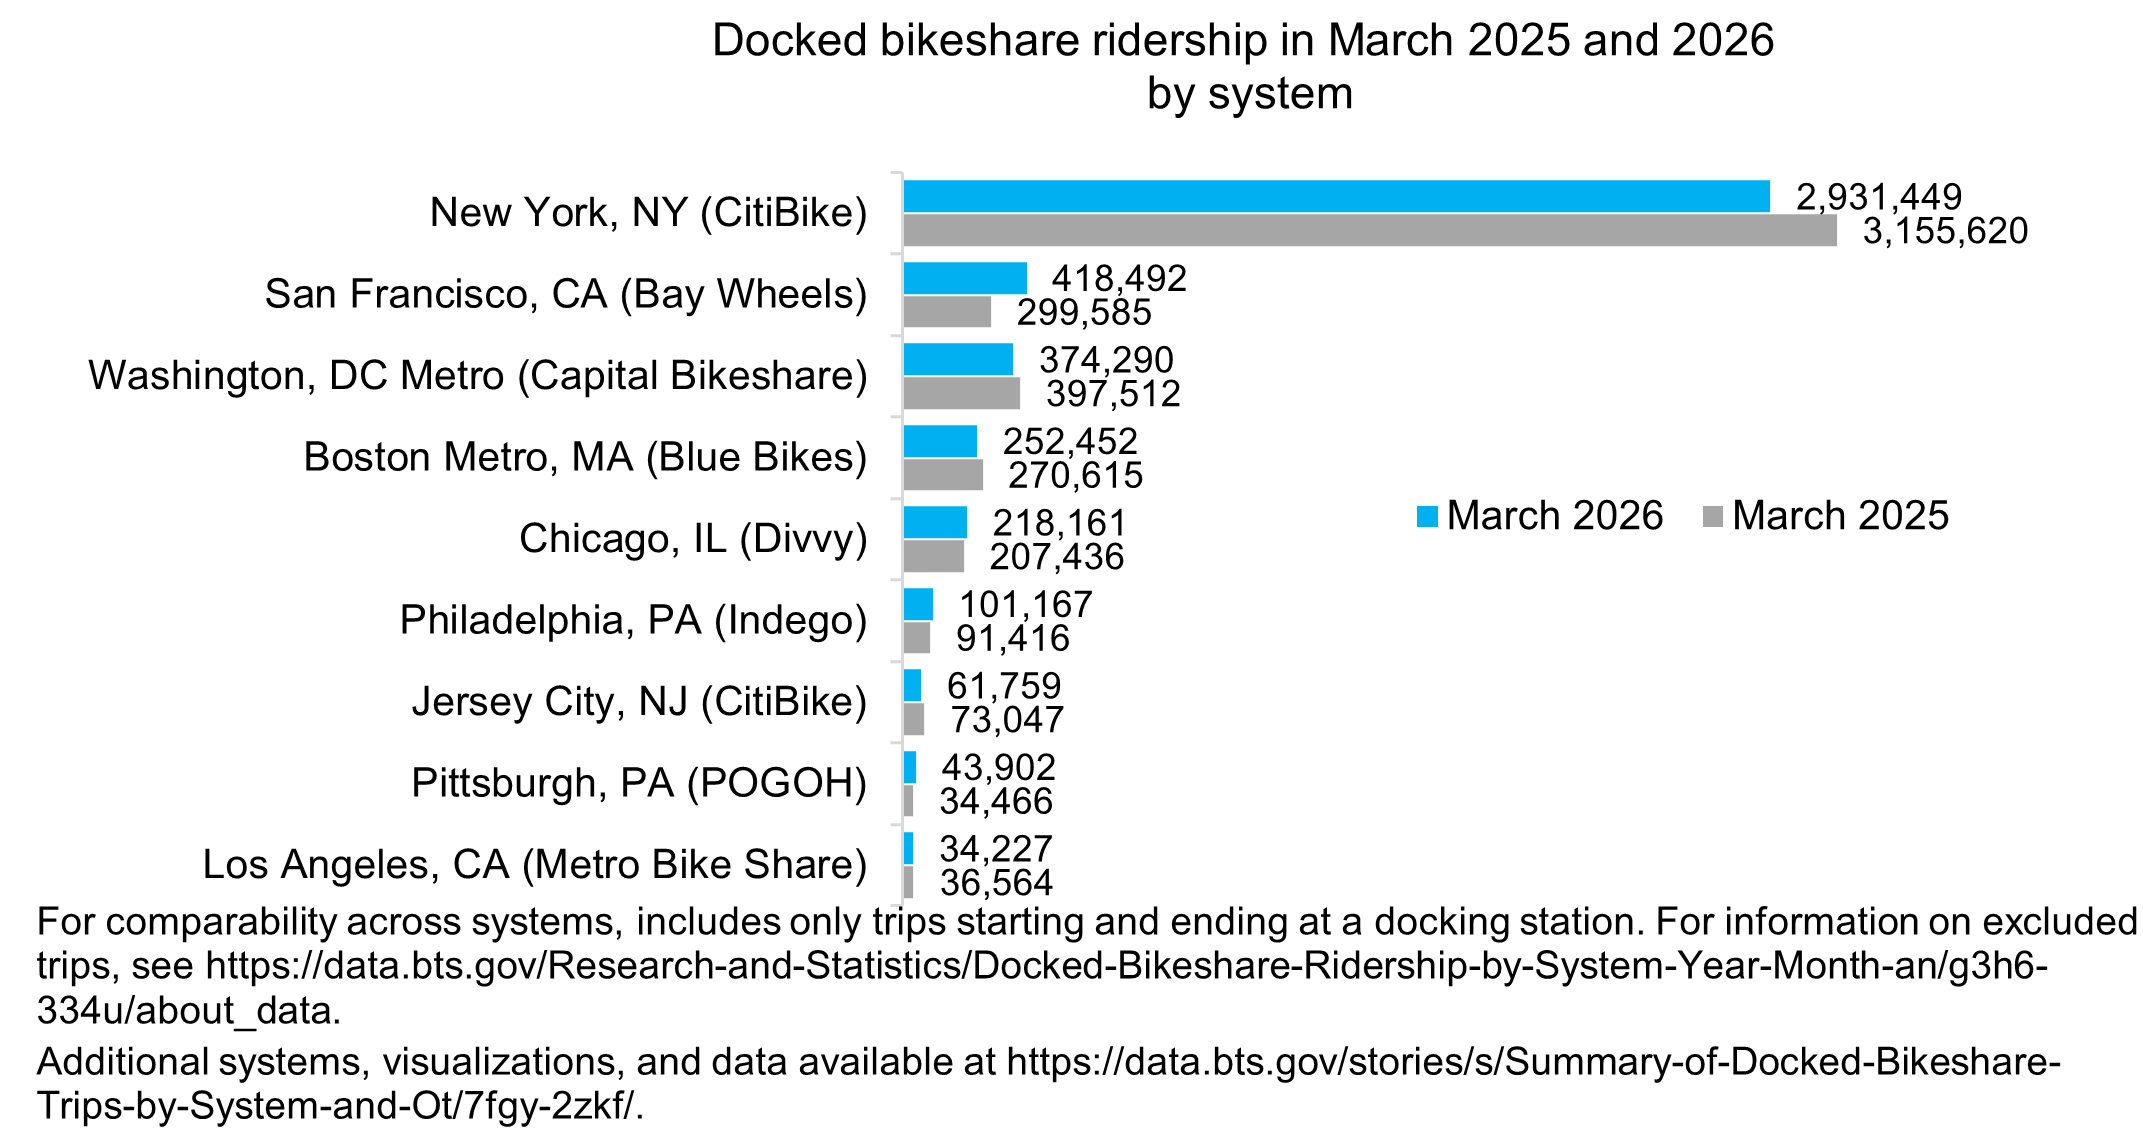
By area served and system, the number of docked bikeshare trips in March 2026 and the percentage change from March 2025:
• New York, NY (CitiBike): 2,931,449 (down 7.1%)
• San Francisco, CA (Bay Wheels): 418,492 (up 39.7%)
• Washington, DC Metro (Capital Bikeshare): 374,290 (down 5.8%)
• Boston Metro, MA (Blue Bikes): 252,452 (down 6.7%)
• Chicago, IL (Divvy): 218,161 (up 5.2%)
• Philadelphia, PA (Indego): 101,167 (up 10.7%)
• Jersey City, NJ (CitiBike): 61,759 (down 15.5%)
• Pittsburgh, PA (POGOH): 43,902 (up 27.4%)
• Los Angeles, CA (Metro Bike Share): 34,227 (down 6.4%)
Total national expenditures on bicycles and expenditures increased 3.6% (adjusted for inflation) from February 2025 to February 2026 (latest available data).
For additional information, data for additional systems, and interactive charts, please visit BTS’ Bikeshare and E-scooters and National Expenditures on Bicycles and Accessories.