
Docked Bikeshare Trips – November 2025
Monday, December 15, 2025
BTS 83-25
Today, the Bureau of Transportation Statistics (BTS) released docked bikeshare trips for November 2025.
From November 2024 to November 2025, docked bikeshare trips starting and ending at a docking station on seven of the largest systems fell 5.4%.
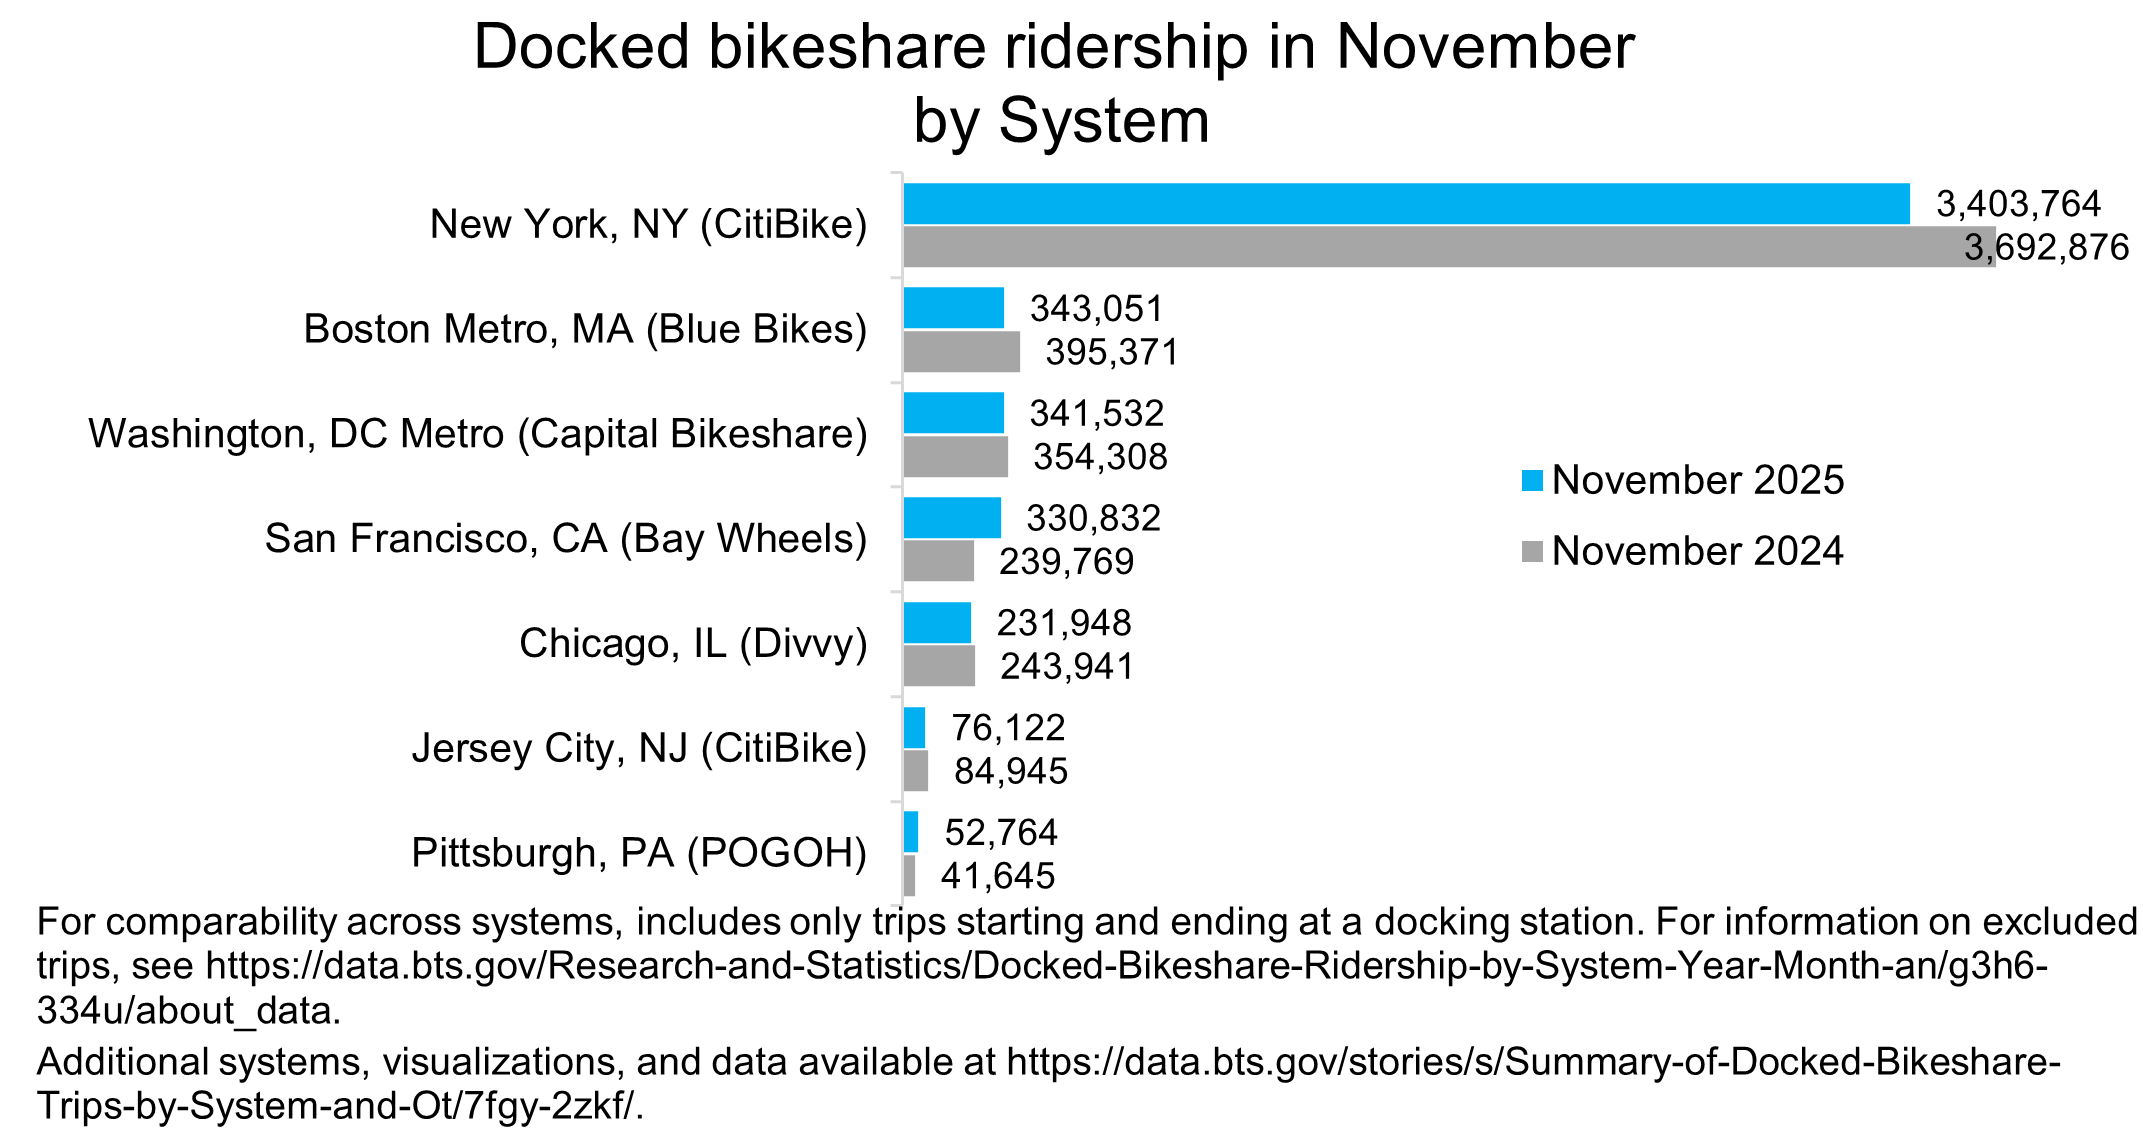
By area served and system, the number of docked bikeshare trips in November 2025 and the percentage change from November 2024:
- New York, NY (CitiBike): 3,403,764 (down 7.8%)
- Boston Metro, MA (Blue Bikes): 343,051 (down 13.2%)
- Washington, DC Metro (Capital Bikeshare): 341,532 (down 3.6%)
- San Francisco, CA (Bay Wheels): 330,832 (up 38.0%)
- Chicago, IL (Divvy): 231,948 (down 4.9%)
- Jersey City, NJ (CitiBike): 76,122 (down 10.4%)
- Pittsburgh, PA (POGOH): 52,764 (up 26.7%)
For additional information, data for additional systems, and interactive charts, please visit BTS’ Bikeshare and E-scooters.
To receive updates from BTS directly to your email, please consider subscribing to our GovDelivery service.