
Docked Bikeshare Trips – October 2025
Monday, November 17, 2025
BTS 71-25
Today, the Bureau of Transportation Statistics (BTS) released docked bikeshare trips for October 2025.
From October 2024 to October 2025, docked bikeshare trips starting and ending at a docking station on six of the largest systems fell 5.7%.
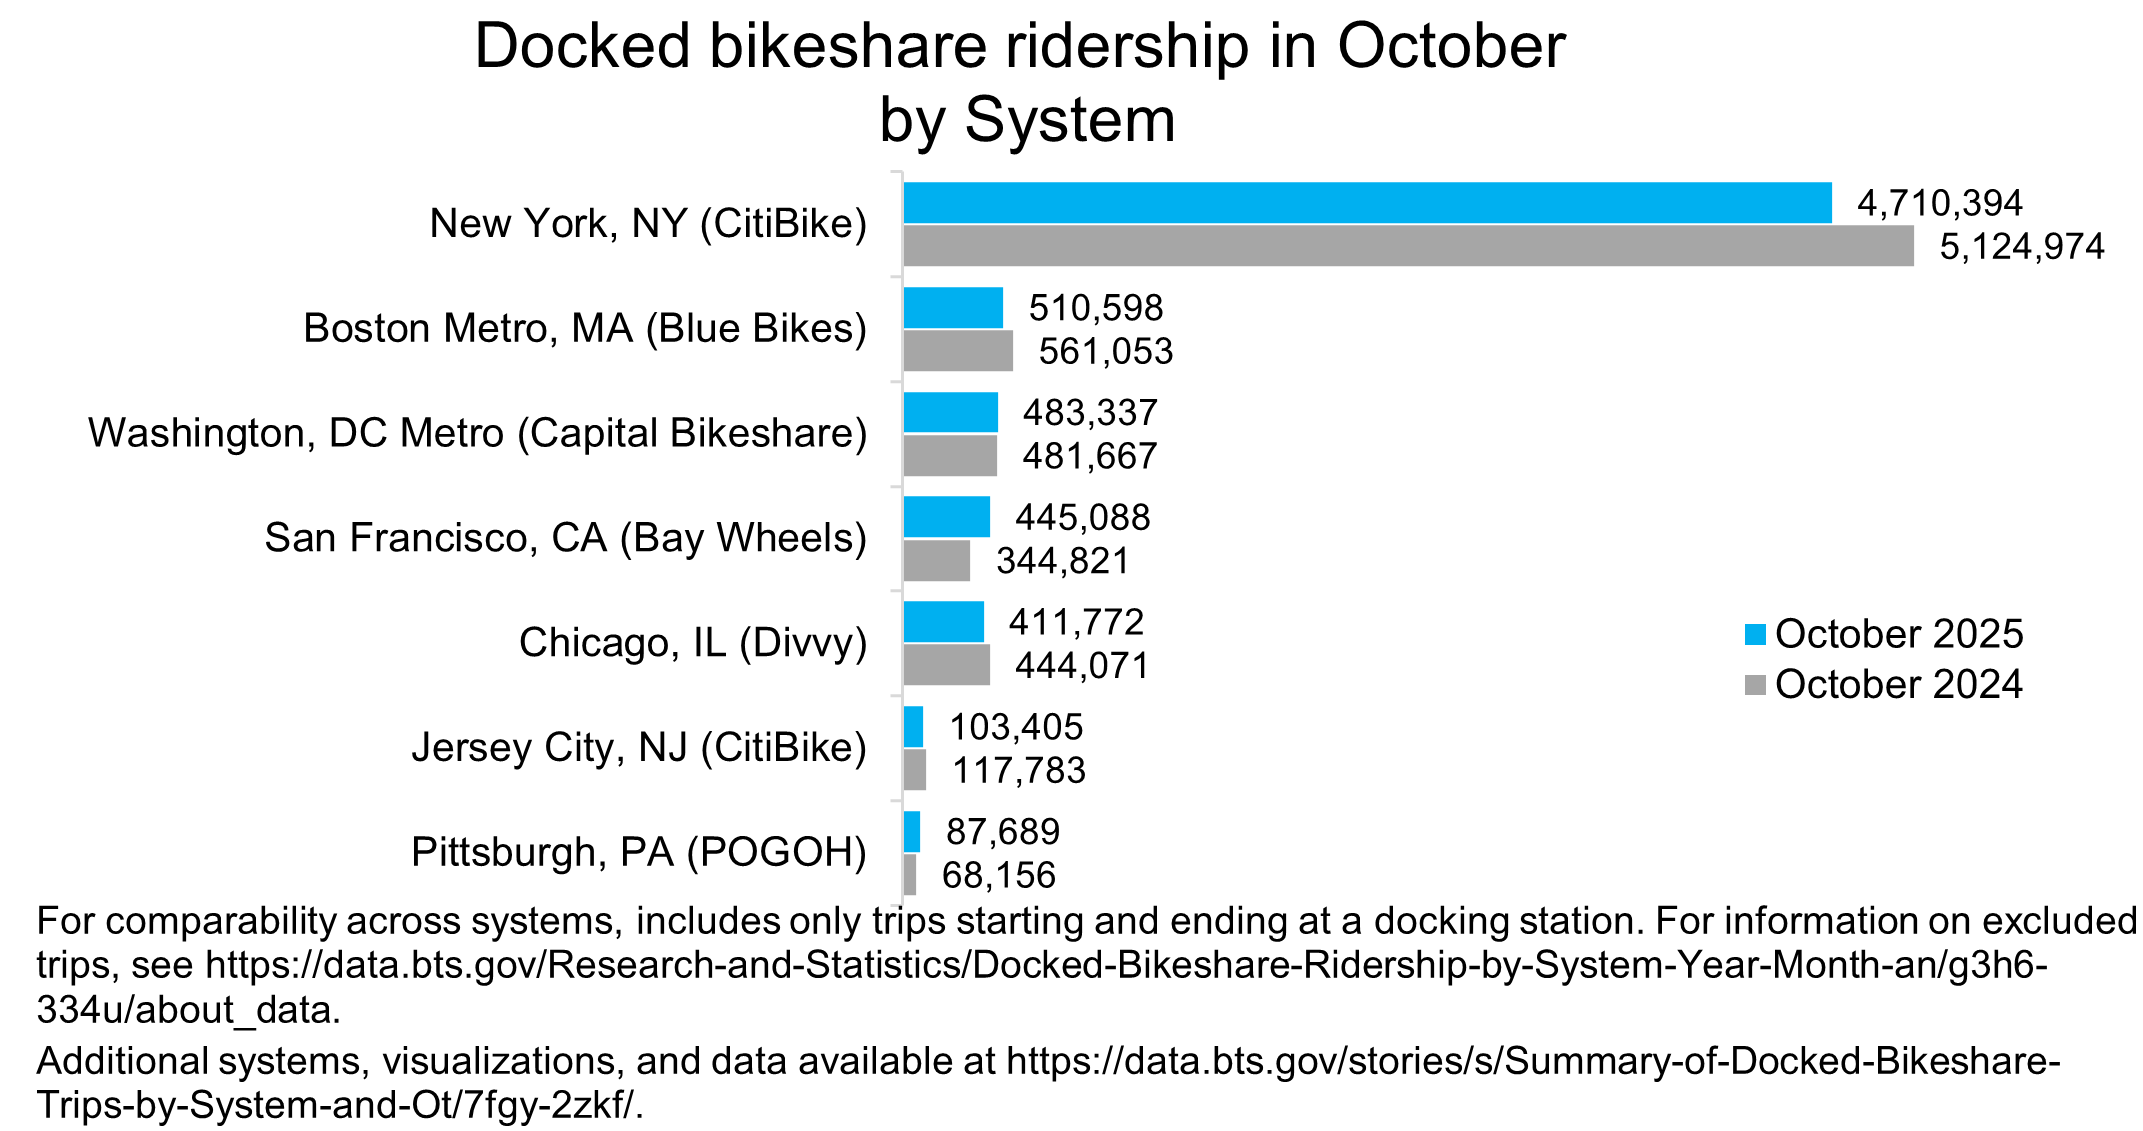
By area served and system, the number of docked bikeshare trips in October 2025 and the percentage change from October 2024 on six of the largest systems with data:
- New York, NY (CitiBike): 4,710,394 (down 8.1%)
- Boston Metro, MA (Blue Bikes): 510,598 (down 9.0%)
- Washington, DC Metro (Capital Bikeshare): 483,337 (up 0.3%)
- San Francisco, CA (Bay Wheels): 445,088 (up 29.1%)
- Chicago, IL (Divvy): 411,772 (down 7.3%)
- Jersey City, NJ (CitiBike): 103,405 (down 12.2%)
- Pittsburgh, PA (POGOH): 87,689 (up 28.7%)
For additional information, data for additional systems, and interactive charts, please visit BTS’ Bikeshare and E-scooters.
To receive updates from BTS directly to your email, please consider subscribing to our GovDelivery service.