
Docked Bikeshare Trips – May 2026
Friday, June 12, 2026
Today, the Bureau of Transportation Statistics (BTS) released docked bikeshare trips for May 2026.
From May 2025 to May 2026, docked bikeshare trips starting and ending at a docking station on seven of the largest systems grew 9.3%.
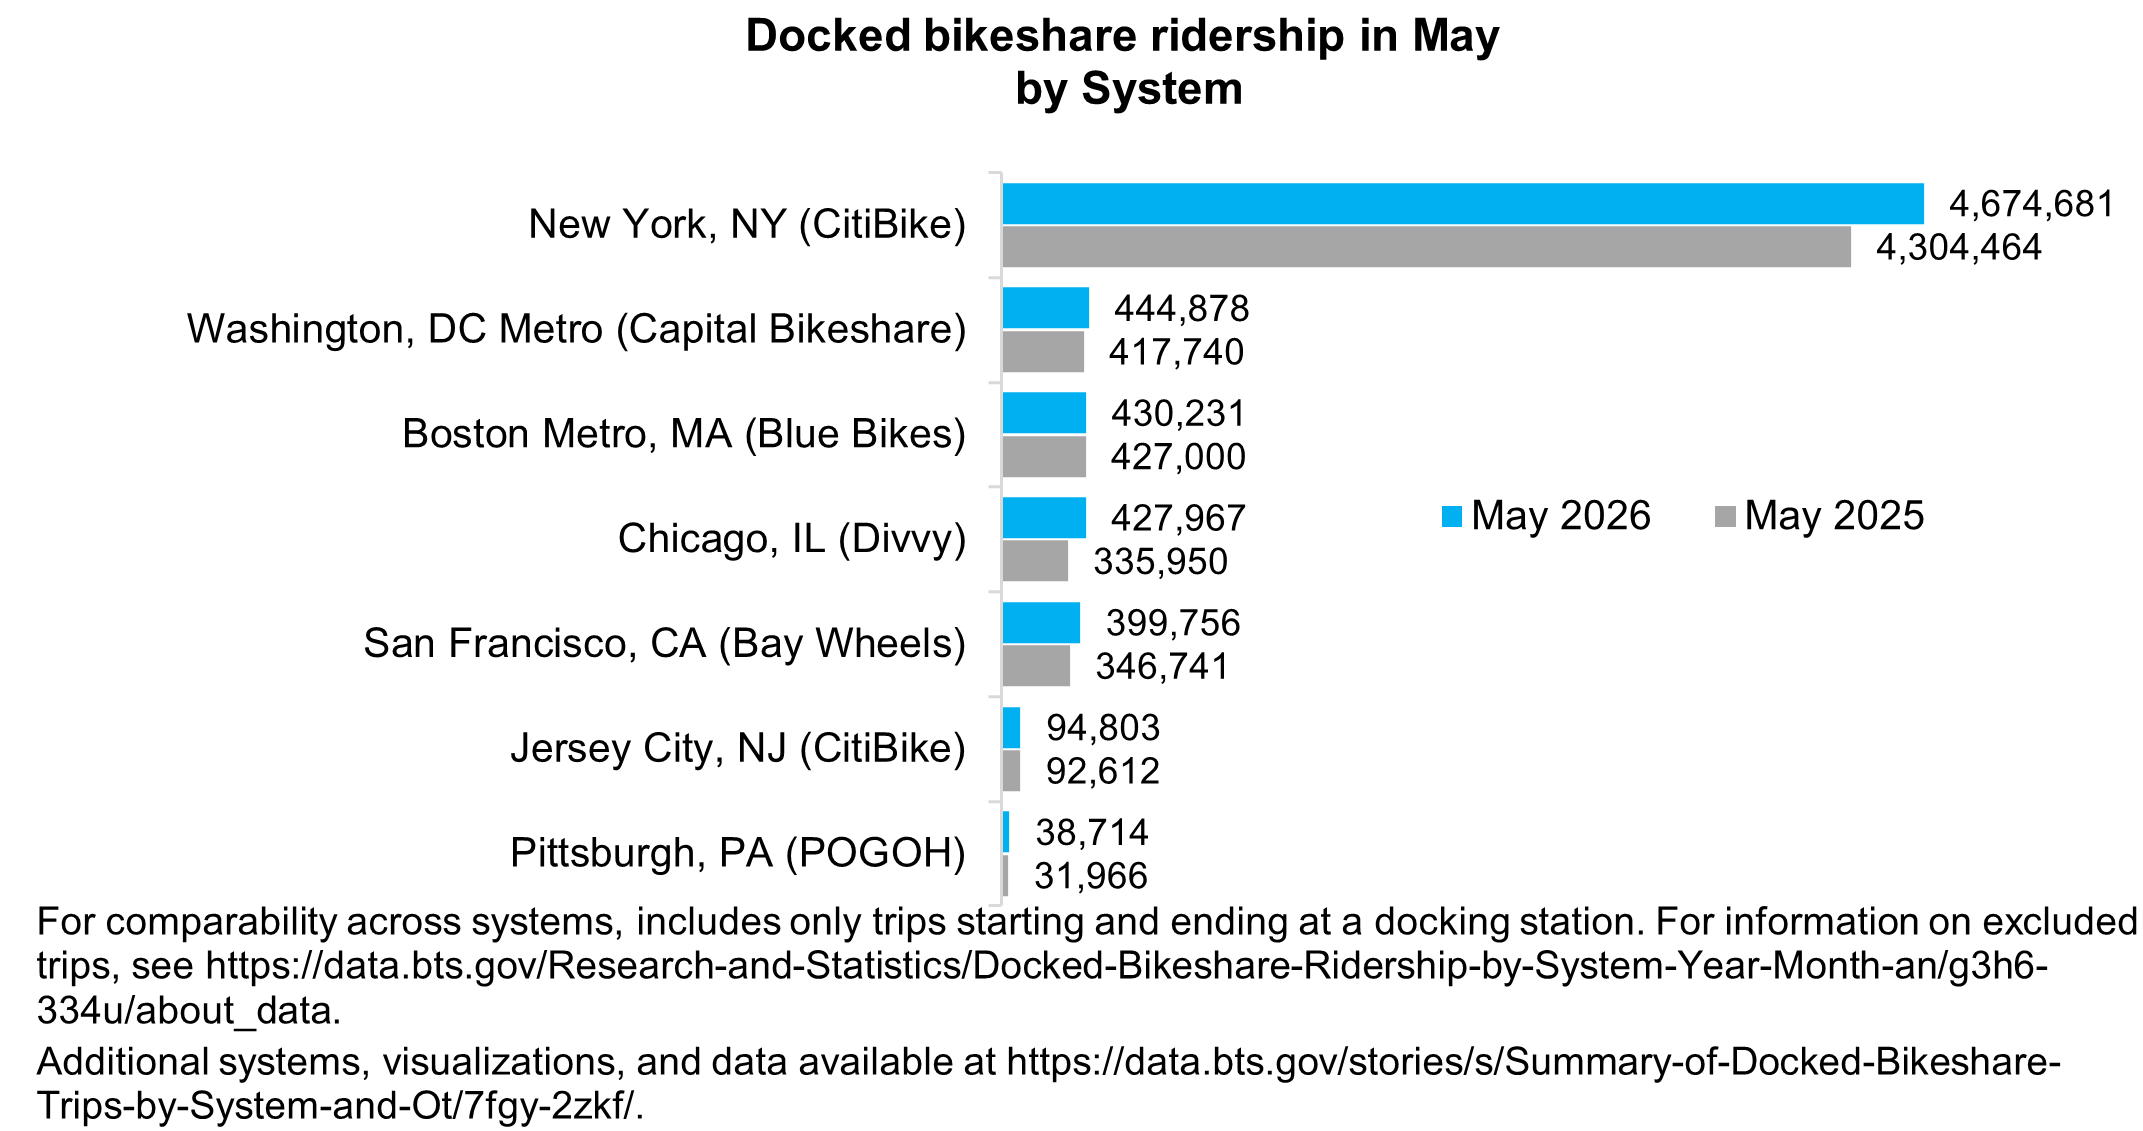
By area served and system, the number of docked bikeshare trips starting and ending at a docking station in May 2026 and the percentage change from May 2025 to May 2026:
- New York, NY (CitiBike): 4,674,681 (up 8.6%)
- Washington, DC Metro (Capital Bikeshare): 444,878 (up 6.5%)
- Boston Metro, MA (Blue Bikes): 430,231 (up 0.8%)
- Chicago, IL (Divvy): 427,967 (up 27.4%)
- San Francisco, CA (Bay Wheels): 399,756 (up 15.3%)
- Jersey City, NJ (CitiBike): 94,803 (up 2.4%)
- Pittsburgh, PA (POGOH): 38,714 (up 21.1%)
Total national expenditures on bicycles and expenditures increased 8.2% (adjusted for inflation) from April 2025 to April 2026 (latest available data).
For additional information, data for additional systems, and interactive charts, please visit BTS’ Bikeshare and E-scooters and National Expenditures on Bicycles and Accessories.