
Employees at U.S. Scheduled Passenger Airlines Month of December, 1990-2020
Figure
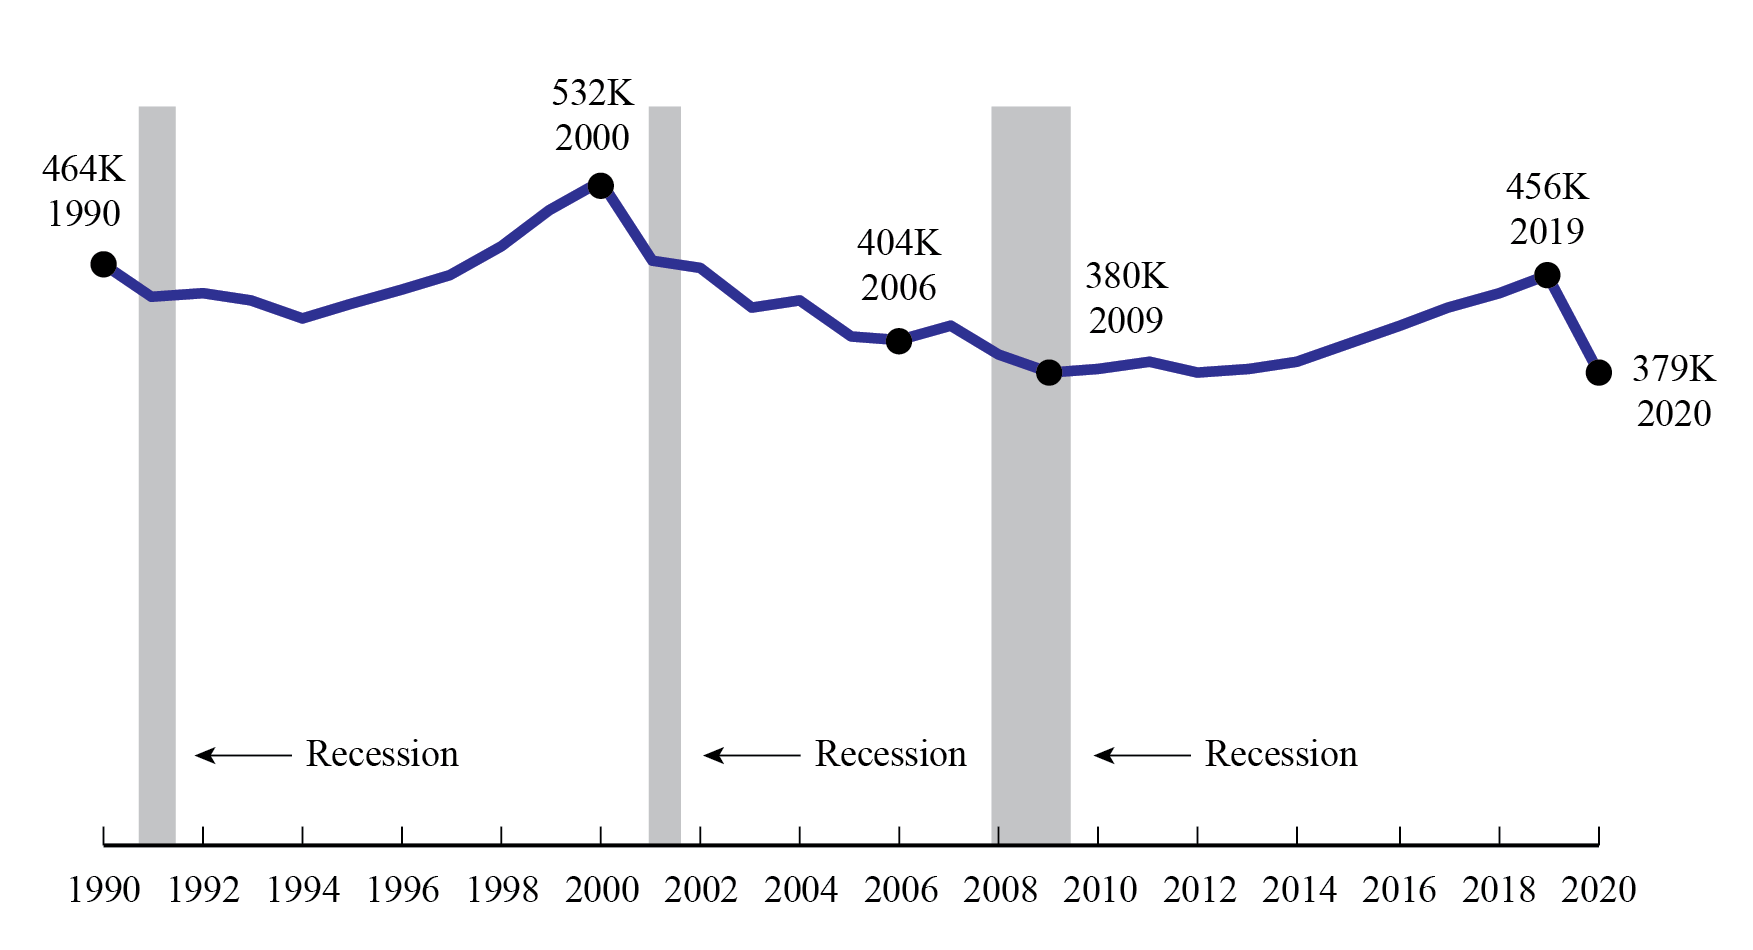
Dataset Table:
| December FTEs in thousands (000) | |
|---|---|
| 1990 | 464.1 |
| 1991 | 440.4 |
| 1992 | 441.0 |
| 1993 | 438.0 |
| 1994 | 423.3 |
| 1995 | 433.8 |
| 1996 | 446.4 |
| 1997 | 455.5 |
| 1998 | 481.1 |
| 1999 | 508.1 |
| 2000 | 531.9 |
| 2001 | 467.0 |
| 2002 | 462.6 |
| 2003 | 431.1 |
| 2004 | 436.9 |
| 2005 | 408.9 |
| 2006 | 404.2 |
| 2007 | 417.3 |
| 2008 | 391.8 |
| 2009 | 379.7 |
| 2010 | 380.4 |
| 2011 | 386.9 |
| 2012 | 379.7 |
| 2013 | 380.8 |
| 2014 | 386.2 |
| 2015 | 401.4 |
| 2016 | 416.3 |
| 2017 | 430.6 |
| 2018 | 442.0 |
| 2019 | 455.6 |
| 2020 | 379.3 |