
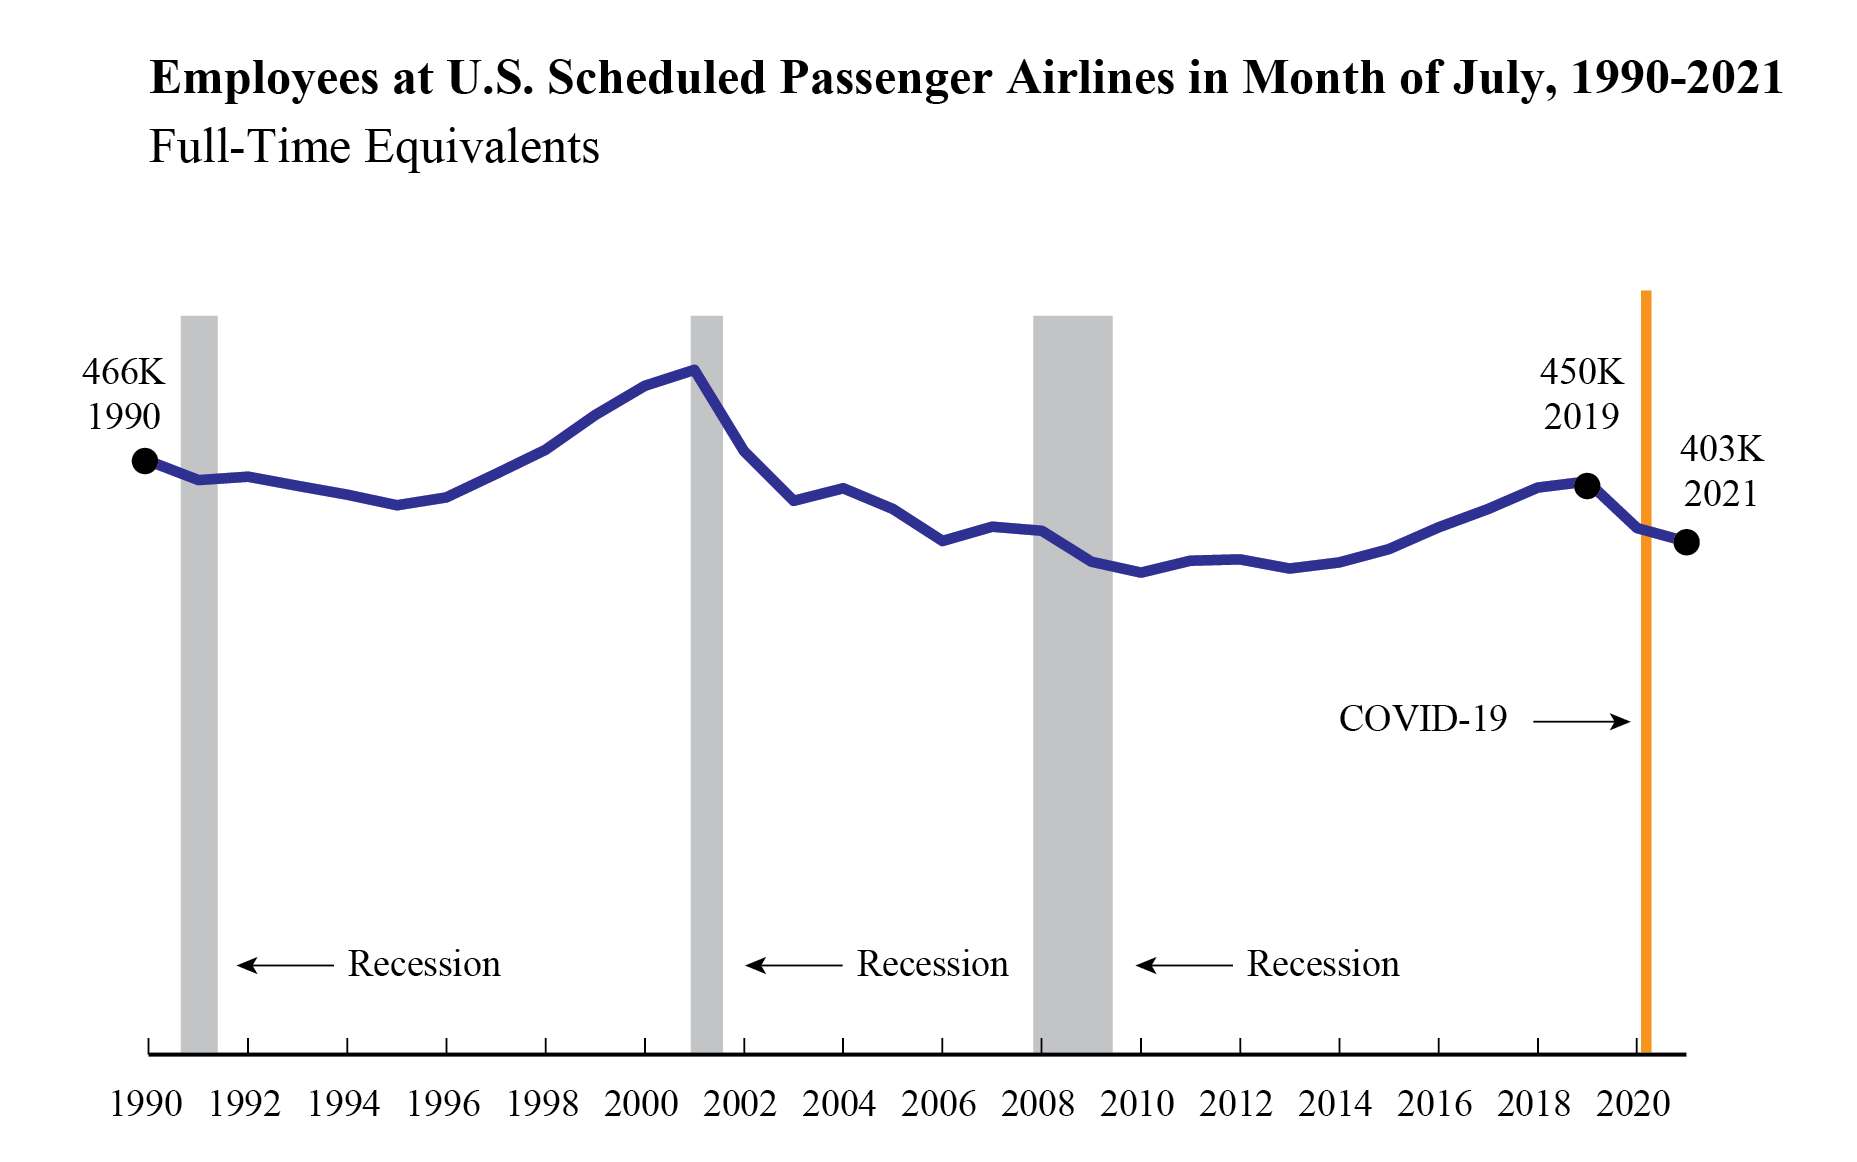
Employees at U.S. Scheduled Passenger Airlines in the Month of July, 1990-2021
Figure
Dataset Table:
| | July FTEs |
|---|---|
| 1990 | 465,774 |
| 1991 | 450,740 |
| 1992 | 453,433 |
| 1993 | 446,362 |
| 1994 | 439,224 |
| 1995 | 430,971 |
| 1996 | 437,205 |
| 1997 | 455,454 |
| 1998 | 474,577 |
| 1999 | 501,670 |
| 2000 | 524,797 |
| 2001 | 537,161 |
| 2002 | 473,371 |
| 2003 | 434,411 |
| 2004 | 444,431 |
| 2005 | 428,091 |
| 2006 | 402,991 |
| 2007 | 414,315 |
| 2008 | 411,095 |
| 2009 | 386,779 |
| 2010 | 378,068 |
| 2011 | 387,495 |
| 2012 | 388,601 |
| 2013 | 381,299 |
| 2014 | 386,243 |
| 2015 | 396,503 |
| 2016 | 413,746 |
| 2017 | 428,209 |
| 2018 | 444,988 |
| 2019 | 449,804 |
| 2020 | 413,056 |
| 2021 | 402,561 |
Notes:
FTE calculations count two part-time employees as one full-time employee.
Source:
U.S. airline employment reports are filed monthly with the Bureau of Transportation Statistics. See the tables that accompany this release on the BTS website for detailed data since 2015 (Tables 1-15) and industry summary data since 1990.